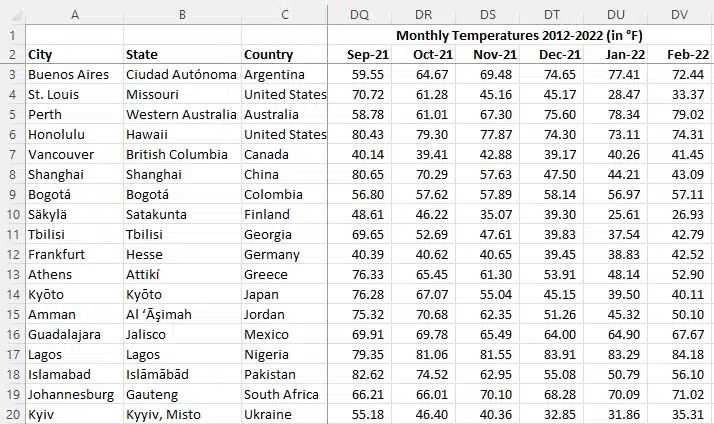
This data set will help you understand the average temperature for each city, town and zip code of the United States. It can answer questions ranging from agricultural opportunities to explaining economic, demographic and commercial developments.
Having daily climate data for all US cities and zip codes has an innumerable amount of commercial, academic, civic and personal applications.
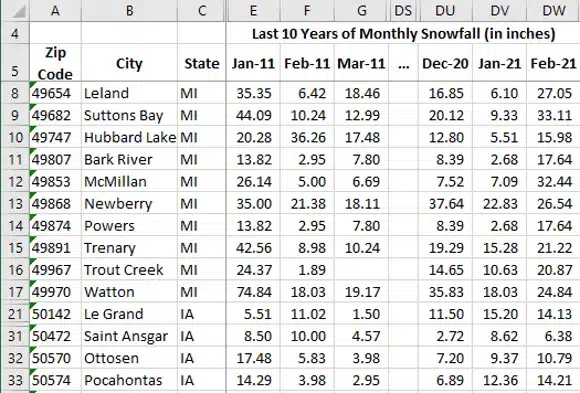
The most fundamental impact weather has is on plants. Unsurprisingly, certain plants and crops need certain climates to thrive as well as a certain level of precipitation. Avocados don’t grow in North Dakota but wheat and barley do. Using this list in addition to advice from local nurseries or agricultural schools can help you know what plants can be grown in your area.
Creating a custom calculator for your website is a great way to engage with visitors and build leads. Though when many think of custom calculators, they think of refinancing or insurance. Using the historical average temperature by zip code is a great feature to include. You often see this with residential solar companies, whereby you can enter your zip code to find out how much you can save in energy costs over time by switching to solar. Another example below is a DIY vineyard website, which shows what type of grape varietals you can grow based on the historical average temperature of your zip code.

Public policy professionals can uncover unique findings by pairing historical average temperatures to economic, demographic or environmental data. For instance, overlaying the average temperature by city over population growth reveals warmer cities and towns saw faster population growth relative to cities with colder average temperatures.

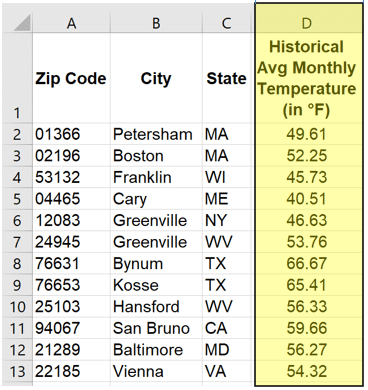
Our ultimate source for the data set is the National Oceanic and Atmospheric Administration or NOAA for short. The NOAA collects and aggregates weather reporting from all weather stations across the United States. We then geospatially convert this information to zip codes and cities. To determine the average daily temperature by city, we take the average of the last 10 years worth of monthly temperatures. Said differently, when you see the average temperature for Idaho Falls, Idaho is 46.93 degrees Fahrenheit, that is based off looking at the last 120 months of average temperatures recorded by Idaho Falls’ nearest weather station.
NOAA
United States Census Bureau

This data set will help you understand the average temperature for each city, town and zip code of the United States. It can answer questions ranging from agricultural opportunities to explaining economic, demographic and commercial developments.
Having daily climate data for all US cities and zip codes has an innumerable amount of commercial, academic, civic and personal applications.
The most fundamental impact weather has is on plants. Unsurprisingly, certain plants and crops need certain climates to thrive as well as a certain level of precipitation. Avocados don’t grow in North Dakota but wheat and barley do. Using this list in addition to advice from local nurseries or agricultural schools can help you know what plants can be grown in your area.
Creating a custom calculator for your website is a great way to engage with visitors and build leads. Though when many think of custom calculators, they think of refinancing or insurance. Using the historical average temperature by zip code is a great feature to include. You often see this with residential solar companies, whereby you can enter your zip code to find out how much you can save in energy costs over time by switching to solar. Another example below is a DIY vineyard website, which shows what type of grape varietals you can grow based on the historical average temperature of your zip code.
Public policy professionals can uncover unique findings by pairing historical average temperatures to economic, demographic or environmental data. For instance, overlaying the average temperature by city over population growth reveals warmer cities and towns saw faster population growth relative to cities with colder average temperatures.
Our ultimate source for the data set is the National Oceanic and Atmospheric Administration or NOAA for short. The NOAA collects and aggregates weather reporting from all weather stations across the United States. We then geospatially convert this information to zip codes and cities. To determine the average daily temperature by city, we take the average of the last 10 years worth of monthly temperatures. Said differently, when you see the average temperature for Idaho Falls, Idaho is 46.93 degrees Fahrenheit, that is based off looking at the last 120 months of average temperatures recorded by Idaho Falls’ nearest weather station.
NOAA
United States Census Bureau