An Overview of the ‘Rainfall Totals by Zip Code’ Dataset
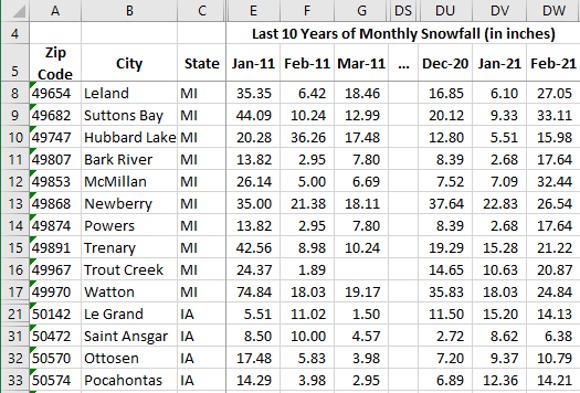
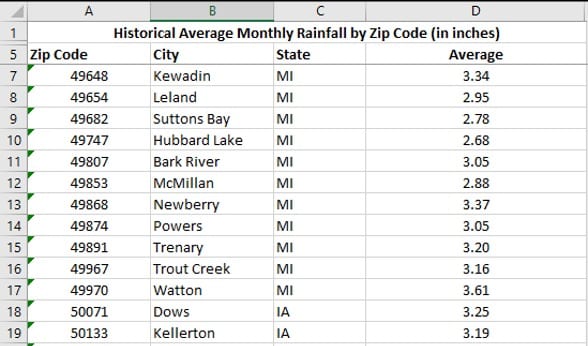
The rainfalls totals by zip code data set is available in the form of an excel spreadsheet, and contains the aggregated historical rainfall amounts each US zip code. It takes into account the daily and monthly rainfall totals in all 42,000 zip codes in the USA and is the calculated average precipitation over a 10 year time frame.
We have collected the data from reliable weather forecast stations across the USA. This user-friendly and comprehensive precipitation spreadsheet contains data about cities, zip codes, and states with their respective average rainfall totals. These valuable precipitation totals offer a complete overview of all the rainfall totals in US zip codes without the need for researchers to enter a single zip code at a time, which is the case on other weather websites.
What Can You Do With City Specific Precipitation Data?
Using the rainfall totals by zip code data set, you can understand the aggregated average rainfall totals in a particular zip code. This data set can answer many questions regarding demographics, agricultural opportunities, commercial and economic developments, and many more.
Few Examples from the Rainfalls Totals Data Set
- How many inches of rain did Atlanta get on average over the last ten years?
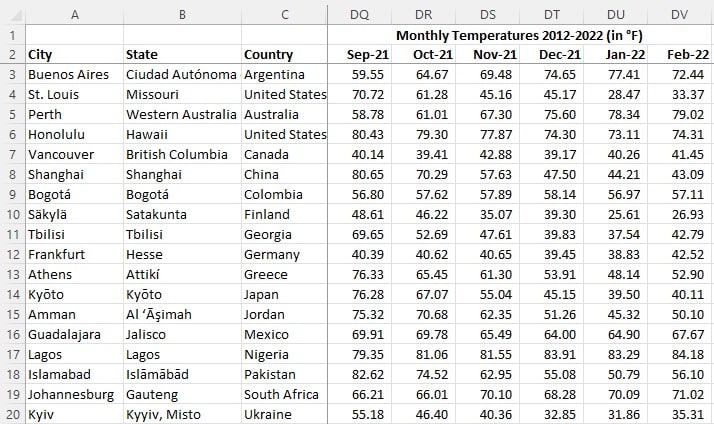
- How many inches of rain did Nashville get on average? How about in 2022?
- What is the wettest city in the US?
- How does one part of Tennessee compare to the rest of the state in terms of rainfall averages?
- Does the western part of the country get more average rainfall vs. the eastern part?
How Have We Collected this Weather Data?
To gather the average rainfall totals by zip code data set, we’ve collected, scraped, organized & transformed the hundreds of millions of data points into this user friendly spreadsheet that you see here. We also check data for any inaccuracies and quality but have not made any adjustments to account for the impact of historical changes in observation or instrumentation practices.
What Can You Do with the Rainfall Totals By Zip Code Data?
The rainfall totals data of various zip codes in the USA can provide valuable information regarding the climate, weather conditions in a particular period, and other insights. This information has several useful applications in commercial, agricultural, economic, construction, civic, and many other sectors.
Find the Records of Low and High Precipitation for Various Areas
Using the rainfalls data of all the US zip codes, you can find which areas have record low and/or high precipitation levels across the country. You can apply this information in many ways to predict trends, geographical climates and more.
Compare Precipitation Across Different Cities and States
The daily rainfall totals data set allows you to compare national and local rainfalls in different zip codes. This enables analysts to look for various climatic and weather patterns and make comparisons based on area and dates, allowing them to generate reports.
Identify Driest or Wettest Areas
Using the rainfall totals data set, you can identify the driest or wettest regions and analyze why some places get more precipitation than others. For instance, some regions in the USA have experienced an extraordinary rise in rainfall compared to others. In contrast, few areas like the Southwest have experienced a significant decrease in precipitation over the years. You can use this information to highlight the impact of weather conditions on the demographics and economy of the specific region.
Make Informed Agricultural Decisions
Rainfall plays a critical role in the agriculture of any area. The national precipitation total by zip code data can help you determine what crops can grow in a particular area. For instance, the areas that receive low rainfall are suitable for growing wheat, millet, corn, and other grains. At the same time, regions with high rain are perfect for growing rice, vegetables, cotton, sugarcane, and other crops.
Aids in Public Policy Decisions
The climate of any region has a significant impact on the lives of people and its economy. The public policymakers and government agencies can use total precipitation by zip code data set to pair it with environmental, demographic, economic, or other data types.
Predicts the Changes in Natural Processes
The rainfall totals data set by zip code allows you to predict the changes in the natural processes because variations in precipitation levels significantly impact the lives of species. It also influences flooding in rivers and helps determine the kinds of plants and animals inhabiting a particular place.