12 data points per zip code, all US zip codes
Excel Download
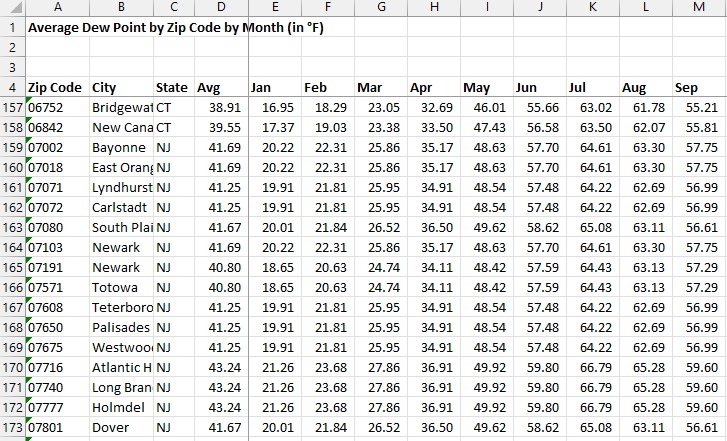
With this version, you have the average temperature for all US zip codes by each month. Especially useful for Direct-to-Consumer companies ensuring their meal kits are insulated enough or tailored appropriately given the weather.
Temperature highs or lows also available as a custom request.
Custom requests or want to be sure this is what you are looking for? Use the chat icon in the bottom left of the screen or email us at contact@weatherdatabyzipcode.com with any questions!
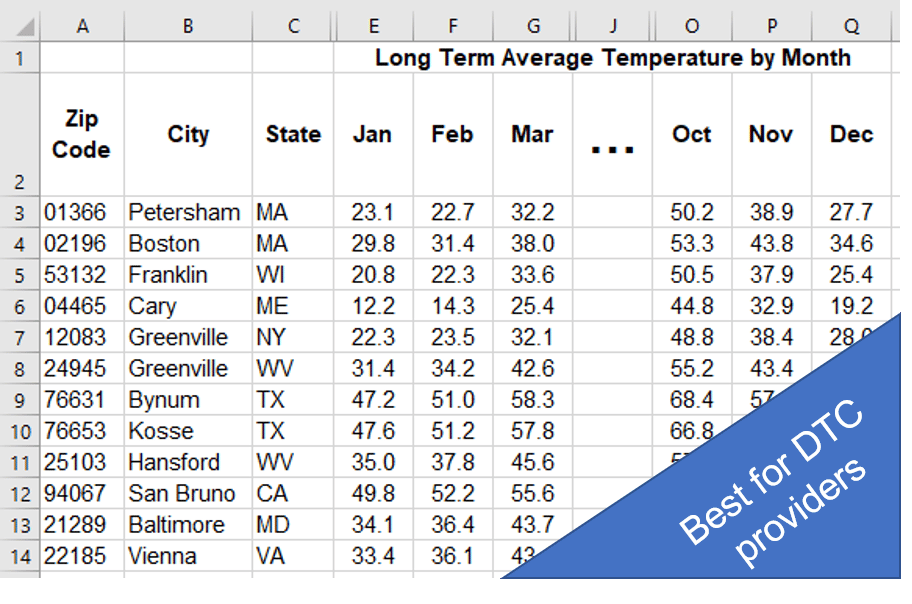
This average monthly temperature by city data set provides a comprehensive vertical snapshot of the average monthly temperatures of each US zip code. It is in the form of an excel spreadsheet, making it easy for you to view detailed information quickly and efficiently. The primary benefit of this time series data set is that it acts as a singular source of truth for temperatures across all US zip codes, states and cities. This way, you don’t need to enter one city or zip code at a time to get the information you need on other climate data platforms.
Average monthly temperature data by city helps you understand temperature and climate changes across all the zip codes in America. It can help answer many questions for Direct-to-Consumer (DTC) companies, and also for agricultural and economic opportunities, commercial developments, and more.
We have collected the average monthly temperature by city-data through vetted and reliable sources. We have utilized the historical reports of the weather stations across the country along with our own research to compile this data. We have painstakingly checked each data point and report to ensure the highest level of accuracy.
Having details of average temperature by city by month has numerous applications in the education, commercial, and agriculture sectors.
Many DTC meal kit companies rely on region-specific weather data year round to ensure that their meal kits are insulated enough or tailored appropriately given the weather. Since the packaging requirements for each region differ month to month based on the weather, having accurate data helps their logistics planning and supply chain run smoothly.
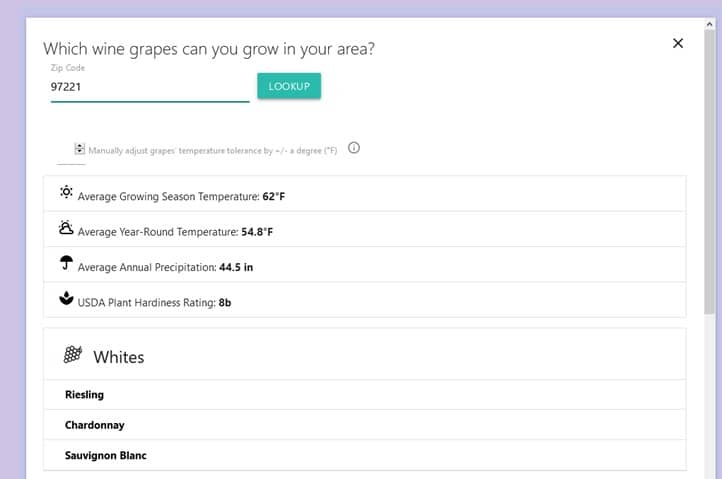
Additionally, creating a custom calculator for your website is a great way to engage with visitors and build leads. Though when many think of custom calculators, they think of refinancing or insurance. Using the historical average temperature by zip code is a great feature to include. You often see this with residential solar companies, whereby you can enter your zip code to find out how much you can save in energy costs over time by switching to solar. Another example below is a DIY vineyard website, which shows what type of grape varietals you can grow based on the historical average temperature of your zip code.
The weather forecast divisions can analyze the historical monthly average temperature data by city to make daily and monthly forecasts. This helps determine particular conditions in specific regions and make pre-arrangements accordingly.
Public policy professionals can uncover unique findings by pairing historical average temperatures to economic, demographic or environmental data. For instance, overlaying the average temperature by city over population growth reveals warmer cities and towns saw faster population growth relative to cities with colder average temperatures.
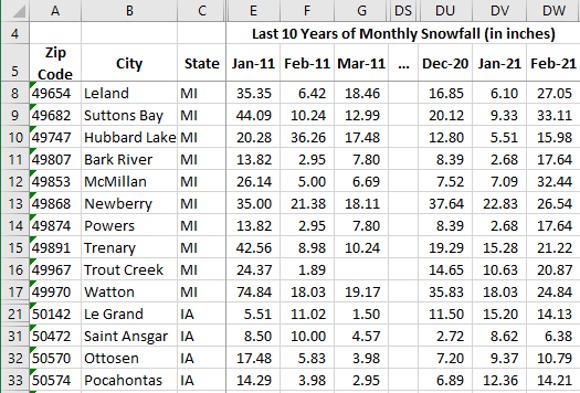
The average daily temperature by zip code helps make time-series and current observations of various climatic changes such as barometric pressure, wind, UV radiations, temperature changes over time, and many more.
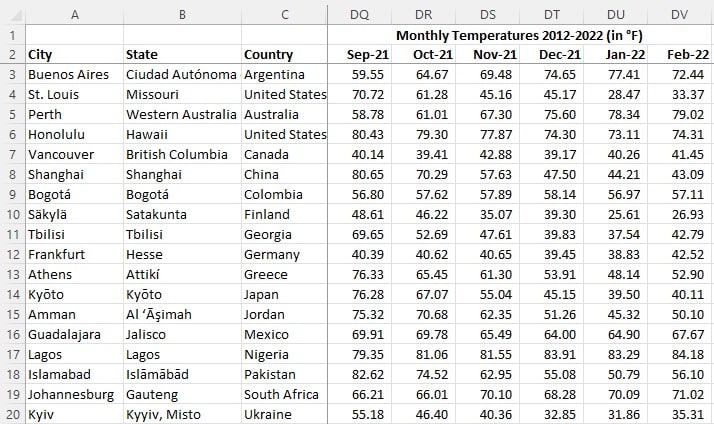
With the help of the average monthly temperature by country data set, you can determine the agricultural opportunities in a particular region. For instance, you can decide whether you can grow water-intensive crops in a specific zip code or not during particular seasons or months. This information can also help the national agriculture department in guiding farmers to grow better crops.
The temperature of the area has a significant impact on people’s lives. Public policymakers can use average temperature by month by city-data along with environmental, demographic, or economic data to derive important insights. This helps them develop effective public policies that help improve people’s lifestyles in a particular region.
Compare: Equivalent coverage from per-location weather services: over $400,000 (OpenWeather at $10/location across 44,000+ US zip codes). One flat price here: $399. No subscription, no API keys — delivered as a ready-to-use spreadsheet.

12 data points per zip code, all US zip codes
Excel Download
With this version, you have the average temperature for all US zip codes by each month. Especially useful for Direct-to-Consumer companies ensuring their meal kits are insulated enough or tailored appropriately given the weather.
Temperature highs or lows also available as a custom request.
Custom requests or want to be sure this is what you are looking for? Use the chat icon in the bottom left of the screen or email us at contact@weatherdatabyzipcode.com with any questions!
This average monthly temperature by city data set provides a comprehensive vertical snapshot of the average monthly temperatures of each US zip code. It is in the form of an excel spreadsheet, making it easy for you to view detailed information quickly and efficiently. The primary benefit of this time series data set is that it acts as a singular source of truth for temperatures across all US zip codes, states and cities. This way, you don’t need to enter one city or zip code at a time to get the information you need on other climate data platforms.
Average monthly temperature data by city helps you understand temperature and climate changes across all the zip codes in America. It can help answer many questions for Direct-to-Consumer (DTC) companies, and also for agricultural and economic opportunities, commercial developments, and more.
We have collected the average monthly temperature by city-data through vetted and reliable sources. We have utilized the historical reports of the weather stations across the country along with our own research to compile this data. We have painstakingly checked each data point and report to ensure the highest level of accuracy.
Having details of average temperature by city by month has numerous applications in the education, commercial, and agriculture sectors.
Many DTC meal kit companies rely on region-specific weather data year round to ensure that their meal kits are insulated enough or tailored appropriately given the weather. Since the packaging requirements for each region differ month to month based on the weather, having accurate data helps their logistics planning and supply chain run smoothly.
Additionally, creating a custom calculator for your website is a great way to engage with visitors and build leads. Though when many think of custom calculators, they think of refinancing or insurance. Using the historical average temperature by zip code is a great feature to include. You often see this with residential solar companies, whereby you can enter your zip code to find out how much you can save in energy costs over time by switching to solar. Another example below is a DIY vineyard website, which shows what type of grape varietals you can grow based on the historical average temperature of your zip code.
The weather forecast divisions can analyze the historical monthly average temperature data by city to make daily and monthly forecasts. This helps determine particular conditions in specific regions and make pre-arrangements accordingly.
Public policy professionals can uncover unique findings by pairing historical average temperatures to economic, demographic or environmental data. For instance, overlaying the average temperature by city over population growth reveals warmer cities and towns saw faster population growth relative to cities with colder average temperatures.
The average daily temperature by zip code helps make time-series and current observations of various climatic changes such as barometric pressure, wind, UV radiations, temperature changes over time, and many more.
With the help of the average monthly temperature by country data set, you can determine the agricultural opportunities in a particular region. For instance, you can decide whether you can grow water-intensive crops in a specific zip code or not during particular seasons or months. This information can also help the national agriculture department in guiding farmers to grow better crops.
The temperature of the area has a significant impact on people’s lives. Public policymakers can use average temperature by month by city-data along with environmental, demographic, or economic data to derive important insights. This helps them develop effective public policies that help improve people’s lifestyles in a particular region.
Compare: Equivalent coverage from per-location weather services: over $400,000 (OpenWeather at $10/location across 44,000+ US zip codes). One flat price here: $399. No subscription, no API keys — delivered as a ready-to-use spreadsheet.