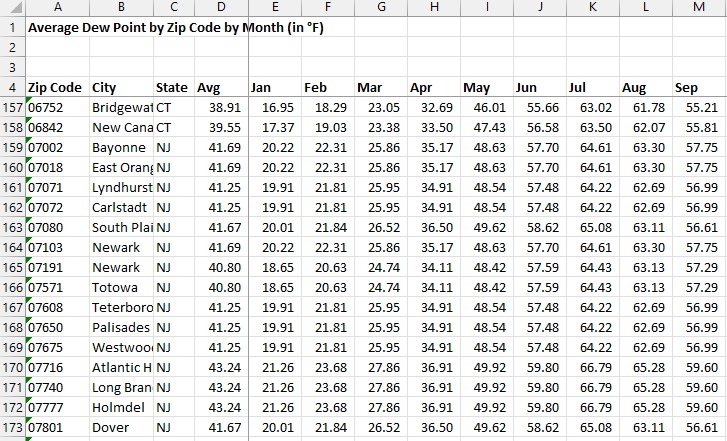
Month-by-Month Humidity History for U.S. Zip Codes
Humidity is an important factor to consider for a variety of planning purposes, yet it can be difficult to track down accurate, well-organized historical data to use for such reasons. This Excel download changes all that, as it offers monthly humidity averages for 40,000 zip codes across the United States. Whatever applications you have in mind for the data, it will be easy to use in this Excel format.
Are Relative Humidity and Dew Point the Same Thing?
To answer the title question for this section, no – dew point and humidity are not the same things. They are very similar, however. If you have always been confused about these two measures, you are not alone.
Dew point, as you may know, is measured as a theoretical temperature. The reported dew point at any given time is the temperature that would need to be reached in order for 100% humidity to occur. If the dew point is listed as 45*F, and the temperature then falls to 45%, the relative humidity for that area will be 100% (assuming no pressure changes).
Relatively humidity, by contrast, is a percentage of the moisture that could be in the air at that time. When the RH is measured at 60%, it means that the air is currently holding 60% of the moisture that it would be capable of holding at that temperature. Remember, going back to high school science class, that warmer air is capable of holding more moisture than cooler air. This explains why a humidity of 70% when the temperature is 80*F will feel quite humid, while a humidity of 80% at 50*F will still be comfortable and feel pretty dry.
How Is Humidity Data Useful?
The humidity that can be expected in a given area is important information for many different types of businesses and organizations. Government groups may need this data for planning purposes, while corporations may want to look at humidity records along with other data points to decide where they are going to make an investment. Some types of operations are better suited for humid areas than others, so it would be a mistake to ignore this valuable bit of information.
Sample Applications for This Information
To bring a little more clarity to this topic, let’s take a quick look at some of the ways in which humidity data might be used for planning purposes.
-
This data set offers month-by-month averages, so businesses can use it to plan how busy they will be throughout the year. An HVAC company serving a humid region, for example, is likely to get more service calls during the worst of the humidity each year.
-
A big company planning a new factory may want to look at humidity records to figure out what location is going to require the most upkeep and repair on various pieces of machinery.
-
The amount of water that needs to be applied to grass and plants will typically drop when humidity goes up, so businesses that manage landscaping can take that into account. For instance, a golf course might be able to plan on using less water during those humid periods, and the facility can budget appropriately as a result.
Frequently Asked Questions
Which climate is better – dry or humid?
Most people will find a dry climate more comfortable, but that doesn’t necessarily mean that it is better. Those dry climates also tend to come along with cold winters – though not in all cases – so sometimes dealing with the negatives of high humidity will be worth it in order to avoid frigid winter conditions. For businesses that are planning out their operations, weighing humidity in addition to many other factors is necessary before an informed decision can be made.
Where is the humidity the worst?
Within the United States, the area commonly referred to as the south tends to have the worst humidity. States like Louisiana, Mississippi, Alabama, and others in the region are often faced with high humidity during the summer months. With that said, it’s certainly possible for humid conditions to exist in other parts of the country, especially up the east coast.
How do I check the humidity in my neighborhood?
Nearly every weather app will provide real-time data on the current humidity conditions in your area. Of course, if you are looking for historical data rather than current reporting, you’ll need to use a source like Weather Data by Zip Code to access accurate records that can be used for modeling and predictive purposes.