120 data points per zip code, nearly 40,000 US zip codes
Excel Download
10 years worth of monthly rainfall history for all US zip codes.
Longer time frames available as a custom request.
Custom requests or want to be sure this is what you are looking for? Use the chat icon in the bottom left of the screen or email us at contact@weatherdatabyzipcode.com with any questions!
Snowfall can bring a region to a grinding halt. Even when a city or town is prepared with the right equipment like plows and sand, heavy snow makes it hard to keep transportation moving. Perhaps more than any other kind of weather, snow has a way of putting life on pause.
We can’t stop the snow from coming, but we can help improve how both public and private organizations prepare for these storms. Using the data offered in this Excel download – 10 years of monthly snowfall data, organized by zip codes across the entire U.S. – allows business and government agencies to make smart planning decisions based on the likelihood of snow events.
With this much raw data available, you will soon find yourself coming up with many different ideas for how you can pull important insights out of snowfall records. To get the ball rolling, we’d like to offer up three examples of questions that could easily be answered by sorting through the data provided in this Excel download.
Watching the trends for annual snowfall in a given area is a potentially useful way to project future years and make adjustments to things like a business model or maintenance schedule.
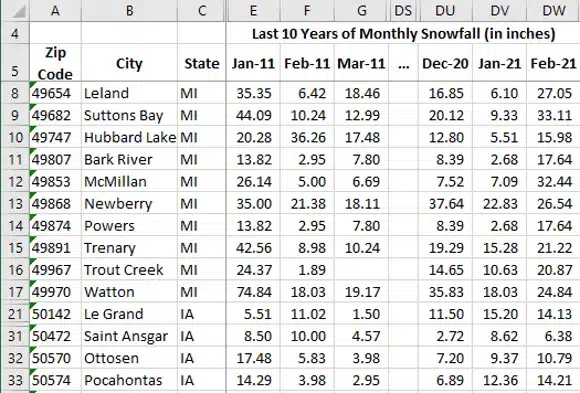
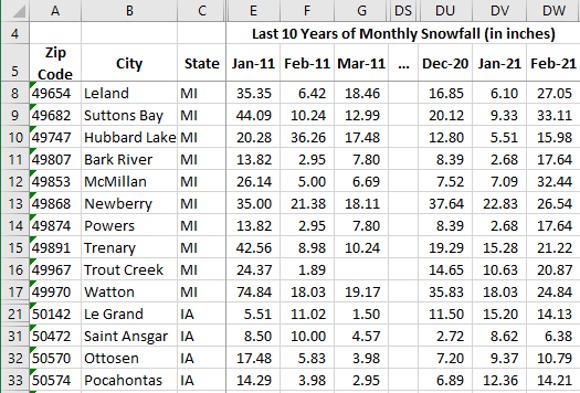
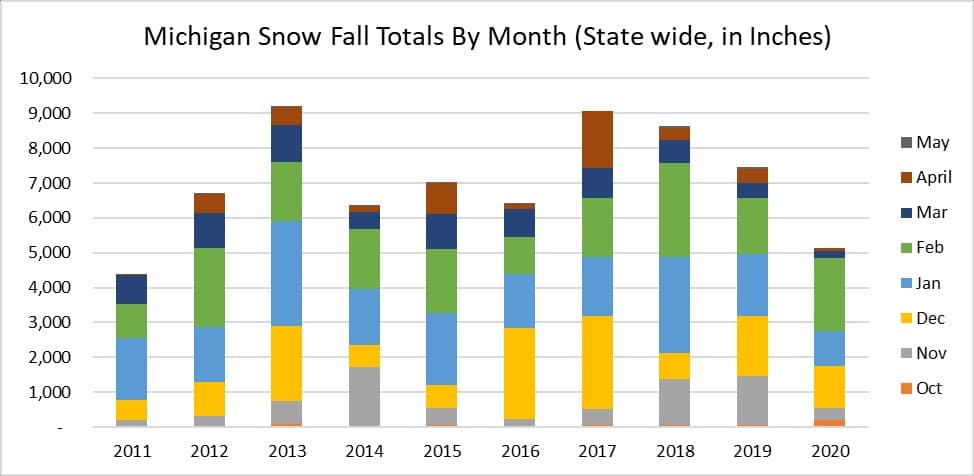
For example, how has the snowfall in various Michigan locations changed from 2011 to 2020? If there is a big change, that insight could drive logical operational adjustments.
By quickly sorting the data in this file, you can see what locations are experiencing the largest changes to their snowfall averages. This could be useful for taking advantage of opportunities in areas that are snowier or not as snowy as they were in the past, and it could also be an important tool for monitoring climate change trends.
In looking over the data, we can highlight two notable trends that show how powerful this information can be.
It’s easy to imagine how a question like this could drive important business decisions. For example, a company that produces winter recreation equipment could target their marketing efforts toward the snowiest parts of the country, without wasting ad spend on areas that don’t really get enough snow to support a thriving market.
You’ll also be able to compare one year to the next quickly when using this data to analyze snow events. For example, when looking at zip codes in Michigan, we can see that the 2020 snow season extended well into April and even May, with some locations getting several inches in April and traces in May. In 2021, however, the snow season largely ended in March, with only small totals in April and no recorded snow in May.
Having this kind of data available is great because you can use it to map changes in business, traffic, or other factors to what was going on with the weather. For instance, if some outdoor businesses got a late start on their revenues in Michigan in 2020, it may have had something to do with that lingering snow season.
The patterns that are revealed by tracking the history of snowfall in recent years can be used in many different applications. Businesses may use these data points to help predict the timing of tourist activity – either when tourists will leave because the snow has arrived, or when they will show up to play in that snow.
Alternatively, scientists can use this kind of information to track changes in the climate, forecast future changes to the weather in localized areas, and more. Solid data is at the heart of nearly all scientific work, and our large data set from the past 10 years of snowfall across the country can serve many businesses and organizations well.
Making important planning decisions shouldn’t come down to guesswork. Sure, you won’t be able to predict exactly what the weather is going to do in a given year, or even a given month, but leaning on accurate data of past snowfall totals will put you on solid footing. This huge collection of a decade’s worth of snowfall in every zip code in the United States will give you the hard data you need to make smart choices. Download now or contact us for more information.

120 data points per zip code, nearly 40,000 US zip codes
Excel Download
10 years worth of monthly rainfall history for all US zip codes.
Longer time frames available as a custom request.
Custom requests or want to be sure this is what you are looking for? Use the chat icon in the bottom left of the screen or email us at contact@weatherdatabyzipcode.com with any questions!
Snowfall can bring a region to a grinding halt. Even when a city or town is prepared with the right equipment like plows and sand, heavy snow makes it hard to keep transportation moving. Perhaps more than any other kind of weather, snow has a way of putting life on pause.
We can’t stop the snow from coming, but we can help improve how both public and private organizations prepare for these storms. Using the data offered in this Excel download – 10 years of monthly snowfall data, organized by zip codes across the entire U.S. – allows business and government agencies to make smart planning decisions based on the likelihood of snow events.
With this much raw data available, you will soon find yourself coming up with many different ideas for how you can pull important insights out of snowfall records. To get the ball rolling, we’d like to offer up three examples of questions that could easily be answered by sorting through the data provided in this Excel download.
Watching the trends for annual snowfall in a given area is a potentially useful way to project future years and make adjustments to things like a business model or maintenance schedule.
For example, how has the snowfall in various Michigan locations changed from 2011 to 2020? If there is a big change, that insight could drive logical operational adjustments.
By quickly sorting the data in this file, you can see what locations are experiencing the largest changes to their snowfall averages. This could be useful for taking advantage of opportunities in areas that are snowier or not as snowy as they were in the past, and it could also be an important tool for monitoring climate change trends.
In looking over the data, we can highlight two notable trends that show how powerful this information can be.
It’s easy to imagine how a question like this could drive important business decisions. For example, a company that produces winter recreation equipment could target their marketing efforts toward the snowiest parts of the country, without wasting ad spend on areas that don’t really get enough snow to support a thriving market.
You’ll also be able to compare one year to the next quickly when using this data to analyze snow events. For example, when looking at zip codes in Michigan, we can see that the 2020 snow season extended well into April and even May, with some locations getting several inches in April and traces in May. In 2021, however, the snow season largely ended in March, with only small totals in April and no recorded snow in May.
Having this kind of data available is great because you can use it to map changes in business, traffic, or other factors to what was going on with the weather. For instance, if some outdoor businesses got a late start on their revenues in Michigan in 2020, it may have had something to do with that lingering snow season.
The patterns that are revealed by tracking the history of snowfall in recent years can be used in many different applications. Businesses may use these data points to help predict the timing of tourist activity – either when tourists will leave because the snow has arrived, or when they will show up to play in that snow.
Alternatively, scientists can use this kind of information to track changes in the climate, forecast future changes to the weather in localized areas, and more. Solid data is at the heart of nearly all scientific work, and our large data set from the past 10 years of snowfall across the country can serve many businesses and organizations well.
Making important planning decisions shouldn’t come down to guesswork. Sure, you won’t be able to predict exactly what the weather is going to do in a given year, or even a given month, but leaning on accurate data of past snowfall totals will put you on solid footing. This huge collection of a decade’s worth of snowfall in every zip code in the United States will give you the hard data you need to make smart choices. Download now or contact us for more information.