Overview of The Dataset: On Average, How Much Snow Does Each Zip Code Get per Month?
From industries that rely on snowfall numbers for business, such as ski resorts, to government entities like the Department of Transportation who rely on snow averages to plan for snow removal, monthly snowfall data is a valuable resource. This Excel spreadsheet offers monthly average snowfall for every US zip code in a simple, easy-to-read format. Weather history is an excellent way to forecast trends that can shape government policy and promote safety in both private and public arenas. From record high temperatures, to abnormally dry conditions – the more you know about your area’s historical climate, the better you can plan ahead. Our historical averages and average temperature data by zip code can help you do just that.
Some Questions This Data Can Help You Answer
Historical weather data by city is an excellent way to deal with questions regarding travel, event planning, and political policy. Long-term averages can give an idea of what to expect and help to forecast in specific areas. Here are examples of some questions that are frequently asked regarding snowfall averages. (1)
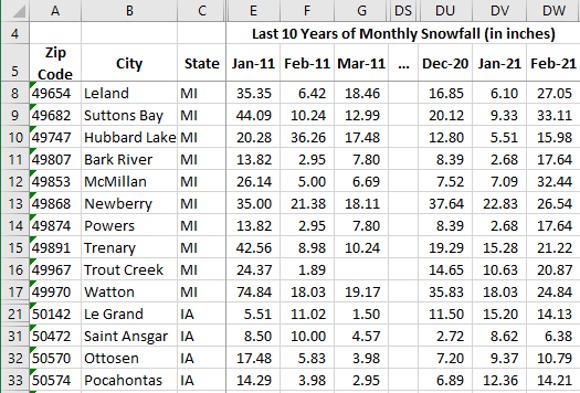
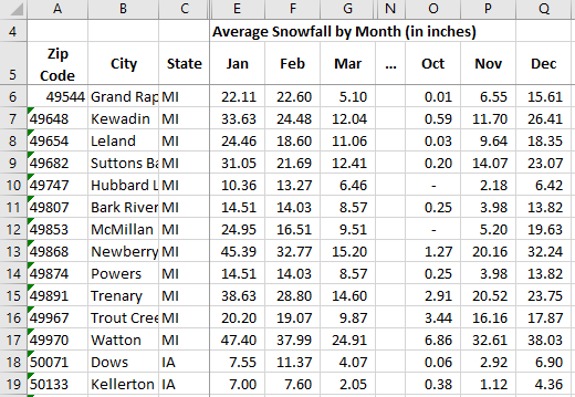
Which month saw the most snowfall collectively across all US cities?
The biggest month was January 2011, with some places seeing about 15.7 inches of snow fall. Overall, the US sees the most snowfall collectively during February, with areas that get snow seeing about 9.4 inches over the course of the month.
If a business is planning an important meeting or event, it’s best to plan around the month that historically sees the most snowfall. Even if the venue is located in a western city with the warmest temperatures and drought, those traveling from other areas are likely to be stymied. This can lead to low participation.
Which state gets the most snowfall in February?
When you break down the data, Maine can see about 24.5 inches of snow in February. For those who enjoy winter sports, this makes it a true vacation destination.
Historical climate data by zip code: How can this data be used?
Weather data, especially in terms of precipitation like snow, can be used in a variety of ways, by a plethora of public and private industries. Here are some examples:
- Airports can better plan for de-icing, snow removal, and other safety precautions
- Ski resorts understand the high volume periods, and can plan for artificial snow accumulation during times of less accumulation.
- Cities can create plans and policies to assist with the unhoused population, as well as lower-income neighborhoods.
- Both public and private sector snow plows can forecast when they may get the most business in specific areas and at certain times of year. Companies can do hiring sweeps for the higher snow volume times so that the public isn’t caught off guard.
- Cities can keep businesses and schools open when there is enough labor to clear sidewalks and streets. Forecasts help predict times when more people will be necessary to do this work.
- Travel planning for both business and pleasure.
- This data is also more and more often used to track climate change indicators. This information can be used by governing bodies to lobby and legislate for change.
- Snowfall affects the water system year-round. Snow trends can help predict disasters such as flooding or drought.
How Often It Snows in Each City Monthly & On An Annual Basis
This data is collected by thousands of weather stations located all across the United States, and recorded in a spreadsheet for easy access. Many entities are now using this information to track changes in historical snowfall for purposes of climate change data collection, as well as more traditional forecasting. (2)
First and Last Snowfalls for the Year By City
Transportation, housing, and energy are all factors that are affected by annual snowfall averages. City officials, businesses, and schools all use climate data to help forecast budget and logistics across numerous categories.
Why Ski Resorts Rely on Historical Snowfall Data
The ski industry has always relied on historical weather data to plan for their tourist season. Their success depends entirely on snow depth and quality, with special emphasis on any changes to historical norms. (3)
This eye to the norms has become especially important in recent years, as many established ski resorts are carefully tracking even minor changes in snowfall due to climate change. Both short-term and long-term forecasting is done with these changes in mind, as the industry struggles to stay relevant in the years ahead.