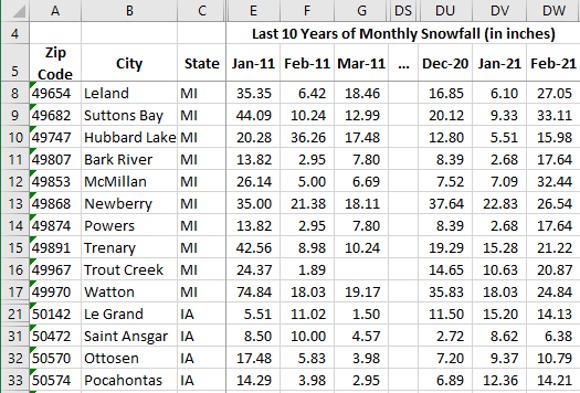
Overview of This Historical Weather Data Set
This Excel spreadsheet is the ultimate guide for researching temperature trends by city or geographical area. Historical average temperature data is collected and recorded across every United States zip code over the past 10 years and presented in an easy to read (and understand) chart. Historical weather data by zip code provides access to temperature records that are invaluable to agriculture, government, and private business.
The Questions This Forecast Information Can Help Answer
Climate trends are a resource that has always been useful in planning projects across numerous industries. These statistics can help answer questions that relate to economic trends, city planning, and government policy.(1)
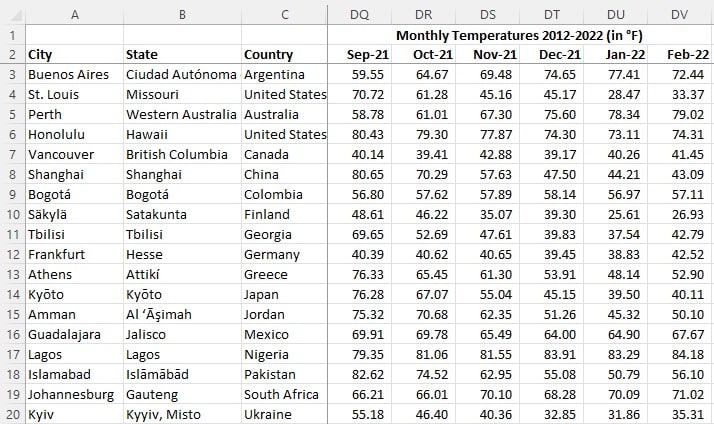
Which month of the year has consistently been the hottest in California over the last 10 years?
By simply scanning temperature records that the spreadsheet provides, you can find the hottest month in California over the past ten years. August is consistently the hottest month of the year for California at an average of 74.9 and the lowest standard deviation (i.e. fluctuation from that average)
Is there a correlation between new businesses started and average daily temperature over the last 10 years?
For those who are interested in starting a new business venture, you can extrapolate the climate data from average daily temperatures in the city you’re interested in to find whether there is a relationship between new business and certain temperature trends.
What has been the hottest day of the year (based on the last 10 years’ average) for New York City?
July 18th has been the hottest day of the year in New York City based on the last 10 year averages with an average of 81.5 degrees.
Collecting the data to answer this question has implications for both government and business. Knowing when to expect the hottest day (which will likely be surrounded by similarly hot days), can help when planning policy for the unhoused population, as well as impoverished areas where energy depletion could be an issue.
Those who run businesses, especially those who use large warehouses and manufacturing factories, can plan ahead for the need for more energy output through cooling these areas. Weather forecasting can become a crucial tool in the forward planning of any organization.
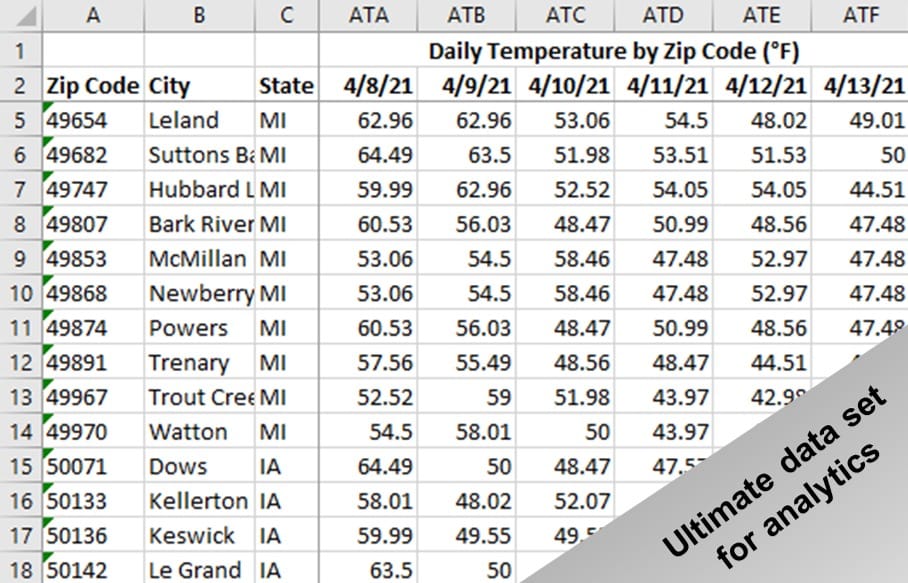
The Ultimate Data Set For Analytics
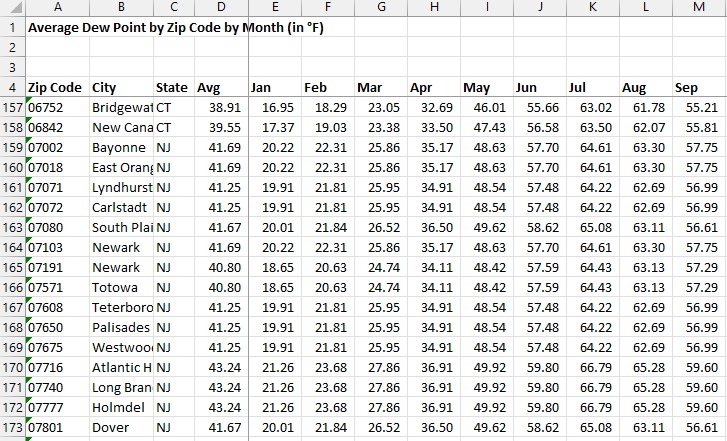
This historical forecast information summary has implications for forecasting trends that can impact socioeconomic areas across the board. Things like low temp average, average wind speed, and dew point are data points for both present and future decision making (2).
Ways to Use This Data
Here are some ways that government, private business, and nonprofits can use this information:
- Budget planning for energy bills
- Deciding the best time of year to launch conferences or outdoor events
- City and policy planning for the unhoused population
- Future modeling for land development
- Agricultural planning and crop rotations
- Supply chain planning
- Forecasting sales of temperature-related goods (air conditioning, ice cream, water parks and other outdoor venues, saunas, hot tubs, etc.)
How is This Climate Data Collected?
This historical climate data is collected from thousands of weather stations across the country, then recorded onto an Excel spreadsheet for easy access.
Why is Past & Current Climate Data Important?
Climate data is integral to decision and policy making in both private and government sectors. By understanding the temperature and weather trends of specific areas, better decisions can be made and disastrous policies avoided. Even on a personal level, it’s important to understand what you need to pack when traveling to a certain part of the country.
This Information Provides Answers To the Following Questions
Here are some common questions that people ask regarding weather related data.
How do you find the average daily temperature?
The daily average temperature can be calculated using a simple average formula. Simply gather the temperature of a given day for a specific city over the last 10 years from a spreadsheet. Take this set of 10 numbers, add them, and then divide by 10. This is your average daily temperature for that day and that city.(3)
What was the weather like on September 11, 2001?
The weather up and down the east coast on September 11, 2001 was clear and temperate. This aided the novice pilot perpetrators of the 911 attacks by providing near-perfect flying weather.
What is climatological data?
Climatological data is a gathered set of measured parameters that help identify weather elements of a specific area–this can include things like temperature, wind speeds, humidity, snow, and violent weather events. This information can be used for further forecasting or planning purposes.
Does weather and temperature impact the stock market?
This is more of a general trend analysis, but it’s an important one at that. Is there a correlation between certain weather conditions and temperature changes and fluctuations in the stock market? Understanding any underlying correlation across these metrics can greatly impact future investment decisions and more.
Access This Climate Data Online Now