An Overview of the ‘Monthly Rainfall Totals’ Data Set
The monthly rainfall totals data set organizes complete details of average precipitation in all US zip codes in an easy-to-use excel spreadsheet. This data includes precipitation measured in inches. We have obtained this data from the historical monthly rainfall observations of thousands of US satellite and ground weather stations over the past ten years.
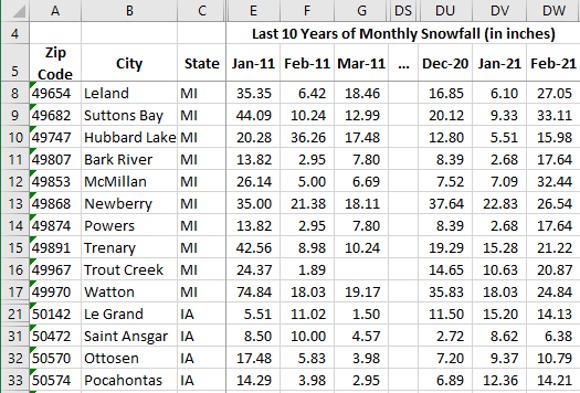
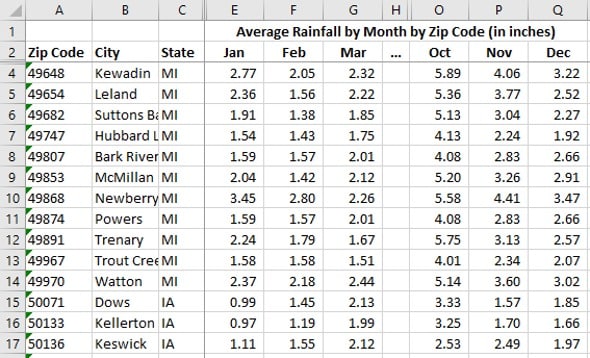
This user-friendly spreadsheet contains zip codes, precipitation totals for each, the accompanying state and city– vertically oriented. You can get a quick birds eye view of monthly rainfall in a particular region. It includes all US zip codes, 41,692 to be exact, and 12 observations for each zip code. This monthly precipitation data acts as a singular source of information, saving you time and resources.
What Questions Do Rainfall Totals by Month Help to Answer?
This monthly rainfall analysis helps you understand rainfall totals, temperature, and previous forecast data in all US zip codes. It allows you to answer many questions from economic to agricultural opportunities, public to commercial developments, and many more.
Some Questions that the Monthly Rainfall Data Set Can Help Answer
- Is October historically drier or wetter than the other months of the year in Michigan?
- What is the wettest month of the year for all western US states?
- The average monthly precipitation in Alaska
- The average monthly precipitation for each US state
How Have We Collected This Weather Data?
We have used a wide range of sources to collect data snapshot details of monthly rainfall in all US zip codes. We scraped and extracted the necessary information from weather stations across the United States and organized this data into a digestible manner. We also integrated reports from the National Weather Prediction Center when necessary to provide you with this comprehensive rainfall data.
What You Can do with this Monthly Rainfall Totals by Zip Code Data
Monthly precipitation data by region can help you in many ways. It can provide valuable insights for various applications in the agricultural, economic, construction, education, and development sectors.
Helps Identify Rainfall Trends and Patterns
Measuring the average daily and monthly rainfall totals by zip code gives you insights into the weather trends and patterns of a particular region. Is the area heading towards draught? Is precipitation decreasing or increasing year over year? It can help you plan your activities and prepare for changes in climate patterns beforehand.
Identifies Potential Flooding Conditions
It’s become more critical for companies and states to observe and monitor average monthly rainfall, especially in areas prone to flooding. With the help of a monthly precipitation map, you can identify areas where flooding is expected due to high rainfalls and plan accordingly before the condition grows worse.
Helps Determine the Plants or Crops You Can Harvest
With the help of monthly rainfall data, you can determine which crops will grow best in a certain area. Certain types of plantations need low or high levels of monthly precipitation to thrive. For instance, wheat and barley grow in North Dakota due to the low level of monthly rainfall in the area, while avocados don’t.
Helps to Develop Public Policies
Public policymakers and planners often use monthly rainfall totals with other historical data such as average daily temperature data, financial or environmental data. This combination of data uncovers helpful information regarding the demographics, economic and other conditions of the specific region’s population, helping them formulate policies accordingly.