An Overview of the ‘10 Years of Daily Precipitation by Zip Code’ Dataset
Rainfall can affect day-to-day operations in many different industries. While it’s easy to have an intuitive sense of whether a certain region is typically wet or dry, more accurate climate data is needed to make a reliable weather forecast model and other strategic plans.
That’s where our detailed Excel rainfall spreadsheets come into the picture. With daily rain data for every single zip code in the United States over the last decade, this download is sure to have the granularity that you need for any project. There is no need to make assumptions or work from questionable data sources when accurate, detailed numbers are readily available for every location in the country.
Some Questions This Weather Data Can Help You Answer
Having a huge database of annual rainfall for the entire United States over the last ten years can unlock countless potential projects. But what would those projects look like, and what kinds of questions can you answer using this historical rainfall data? The uses you have for this rainfall database will be customized to your field, but the three questions below are great examples of what can be done.
Which City Had the Greatest Historical YoY Change in Rainfall Over the Last 10 Years?
Dramatic changes in rainfall patterns can impact the way businesses operate. There is an obvious correlation between rainfall totals and operations in the agricultural field, but that’s just one of many industries that are impacted by weather. Tourism is another area that can be greatly impacted by rain.
So which city saw the greatest year over year change in rainfall over the last decade? Riverside, CA takes home this title. It’s no wonder this city is a fan favorite for its beautiful greenery and nature walks. As for the city that saw the greatest volatility and fluctuation in rainfall, Salton City, CA takes this title.
Which City Has Consistently Been the Driest Over the Last Decade?
In business, or in government, it’s dangerous to make assumptions about the climate. You may assume that a particular city or zip code is dry most of the year, but does the rainfall data bear out that assumption? Even in a dry place, there is usually some rain that falls – but how often does it fall and how much comes down? You won’t have to guess when the numbers for every day of the last ten years are in black and white on your screen.
Beatty, Nevada, on the edge of Death Valley, is the driest city in the US, seeing only 0.15 inches of rain over the course of a month on average. It also is the most consistently dry, with the lowest standard deviation of rainfall.
How Does Rainfall Frequency Compare to Rainfall Totals In a Zip Code?
There is a practical difference between a place that gets a lot of rain and a place that has a lot of rainy days. For example, the climates of Seattle and Miami are quite different, but perhaps not in the way you would expect. In Seattle – a city famous for rain – there are more than 150 days of precipitation per year, on average. Yet, with all those rainy days, the total rainfall average is less than 40’’. By contrast, Miami has just over 140 days of precipitation in an average year – 10 less than Seattle – and it gets over 67’’ of rain annually. With fewer days of rain, Miami records more than two feet more rain than Seattle.
With the data included in this download, you can pull out these kinds of insights for any zip code in the United States. Whether it’s a construction company trying to figure out how many rainy days will impact a project, or a market research company helping clients make strategic decisions about where to open new locations, accurate rainfall data is a big advantage.
Why Rainfall Data & Forecast Information Tracked Over Time is Important
Taking only a snapshot of rainfall data for a certain location doesn’t give you any insight into trends that might be occurring in the area. For example, if you know that it rained 20’’ last year in a given zip code, you still won’t really know what to expect for the coming year. Was that 20’’ of rain more or less than usual? Is there a prevailing trend that has developed over the past decade that indicates wetter or drier weather should be expected moving forward?
The granularity of the rainfall data you use for your research is also important. Since we offer daily rainfall totals for the last ten years, you can group and divide the data any way you like. For instance, you could calculate how many days of measurable rain a zip code received in a year, or how many days with over .5’’ of rain. Looking at totals is a good starting point, but the interesting discoveries are often revealed when you dive deeper – and our data makes that possible.
2022 Rainfall Totals by Zip Code
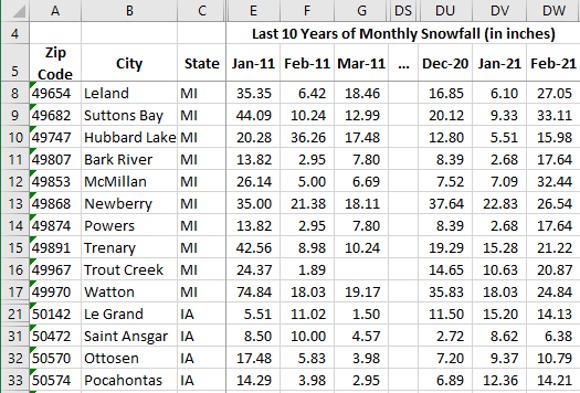
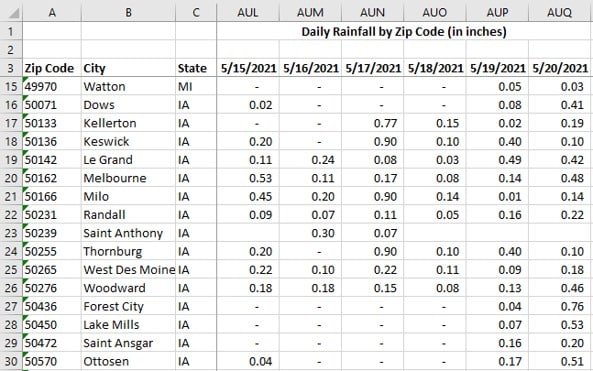
While the depth of this data is a big advantage for many research projects, 10 years’ worth of daily rainfall totals means 3650 data points for each zip code; you can also use this Excel download to take a look at more recent events. For example, here are some notable findings when combing through the 2021 numbers:
- The northeast portion of the U.S. experienced a particularly wet stretch of weather throughout the first half of July. If businesses experienced a downturn in tourist activity during this stretch, they may be able to map those results to the rain totals found in the data.
- In midwestern states like Michigan, Iowa, and Wisconsin, the first half of June 2021 was particularly dry. Agricultural operations may find that more irrigation water was required during this time due to the lack of rainfall.
Access The Rain Data You Need Online, Now
This download provides an incredible amount of climate data online in one place. Whether you are trying to search the details of local rainfall patterns in a specific place, or you work for a national organization and need an overview of a county or various regions, you’ll find the weather history you need in this Excel download. By purchasing this product today, you’ll gain instant access to rainfall totals for every zip code on every day of the last decade. Need even more severe weather data? Contact us for a custom report. We look forward to serving you!
Compare: Equivalent data volume from Visual Crossing’s metered API: ~$16,000 (10-yr daily, all US zips at their published $0.0001/record rate). From OpenWeather at $10/location: over $400,000. One flat price here: $3,995. No subscription, no API, no assembly.
Only need the single overall average? That dataset is free.