Dataset Overview
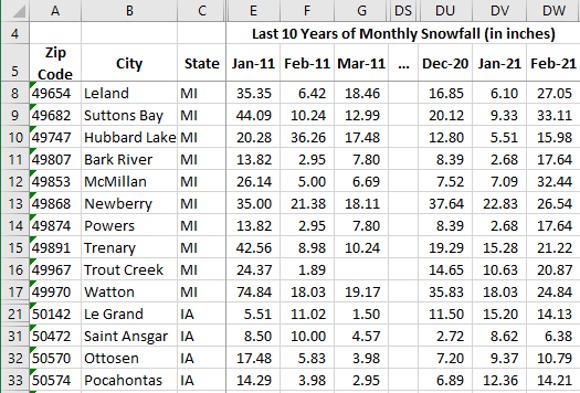
Historical Snowfall Data by Zip Code organizes data in an excel spreadsheet to provide a detailed overview of the average snowfall in the USA. This data is based on the observations of historical monthly average snowfall from innumerable human-operated and automated weather stations across the US over the last 10 years.
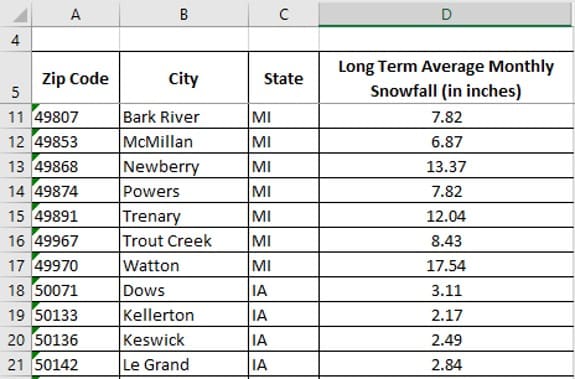
This data set includes the zip code, state’s name, city, and long-term average monthly snowfall in inches. Use this data set to get a quick view of the information you need instead of spending time and effort searching by city one at a time. Even if you go through the National Weather Service’s website, you won’t find this comprehensive and concise information in a unified form.
What Types of Questions Can this Data Help Answer?
With the help of this historical snowfall dataset, you can understand the weather conditions of a particular state or a city according to zip code. It can help answer multiple questions from economic to agricultural opportunities, demographics, scientific research, climate changes, and much more.
Some example facts from historical snowfall data by zip code
- Watton City in Michigan sees the highest long-term monthly snowfall with an average of 17.54 inches, making it one of the coolest cities in MI.
- Kellerton city in Iowa, with zip code 50133, has the lowest level of monthly snowfall, with an average of only 2.17 inches.
How We Collected This Weather Data
National Oceanic and Atmospheric Administration (NOAA) is our ultimate source of gathering historical climate data by zip code. This federal weather department is responsible for collecting and aggregating past weather reports from weather stations located across the USA.
We have painstakingly gathered this information and transformed it into the spreadsheet that you see here. We looked at the history of snowfall data- the average of the last ten years (2010 – 2020) month over month, to determine this information. Simply put, when you see the average snowfall of Mcmillan in MI, it’s based on the average monthly snowfall records of the weather stations nearest to Mcmillan during the last 120 months.
What You Can Do With the Data/Applications
Our historical average snowfall data by zip code spreadsheet offers several economic, civic, educational, personal, and research applications.
Help you determine which plants or crops you can harvest in the area
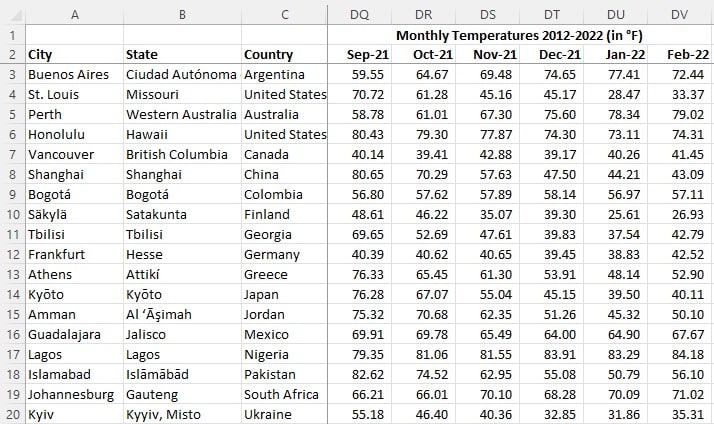
Different types of crops or plantations need certain weather conditions or climate and precipitation levels to thrive. You can also download our average daily temperature data by city spreadsheet to decide which crops you can realistically grow in a particular region. With the help of this list, you can also give recommendations to local farmers, nurseries, and agricultural departments regarding the selection of crops for harvest during the season.
Create and integrate custom snowfall calculator
If your platform provides weather forecasts or weather-related services, it’s a great idea to create and integrate a custom historical snowfall data by zip code calculator. This not only improves your website traffic but also enables you to engage your potential customers and boost conversions. Solar companies, horticulture services, farming, and many other businesses can benefit from this custom calculator.
Help to predict future climate changes
Historical snowfall data can give a refined picture of the weather in a particular region in the US. This helps to forecast and monitor future climate changes and weather events that can impact the lives of people, the environment, and communities in the region.
Help plan economic developments
Public policy planners and professionals can pair this historical snowfall data with demographic, environmental, or economic data sets. This allows the authorities to plan economic developments accordingly with better chances of project success. For instance, comparing the average monthly snowfall by zip code with the growth of population may show that cities and states with low snowfall levels have a higher rate of population growth as compared to cities with a higher monthly snowfall average.