120 data points per zip code, all US zip codes
Excel Download
10 years worth of monthly temperature or precipitation for all US zip codes. An analyst’s dream come true. See how sales or any other economic data is correlated to the weather.
Longer time frames as well as temperature highs or lows also available as a custom request.
Custom requests or want to be sure this is what you are looking for? Use the chat icon in the bottom left of the screen or email us at contact@weatherdatabyzipcode.com with any questions!
When doing detailed analysis, complete and accurate climate data is essential. Perhaps the biggest hurdle you face when trying to map the relationship between the weather and your business is finding trustworthy climate data to use in your analytics. With the right source of data, it’s amazing what insights you can bring to life.
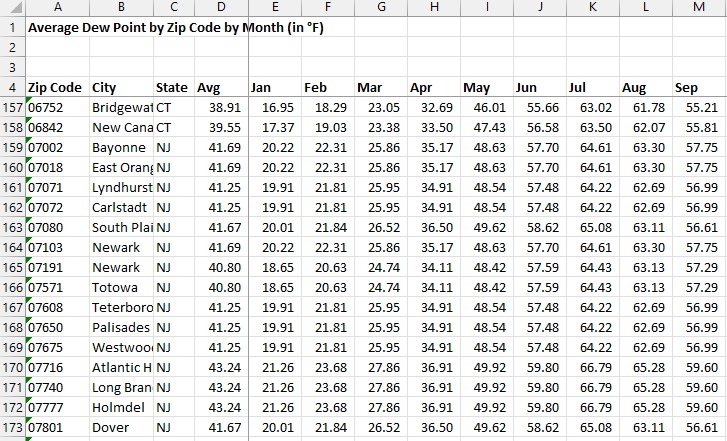
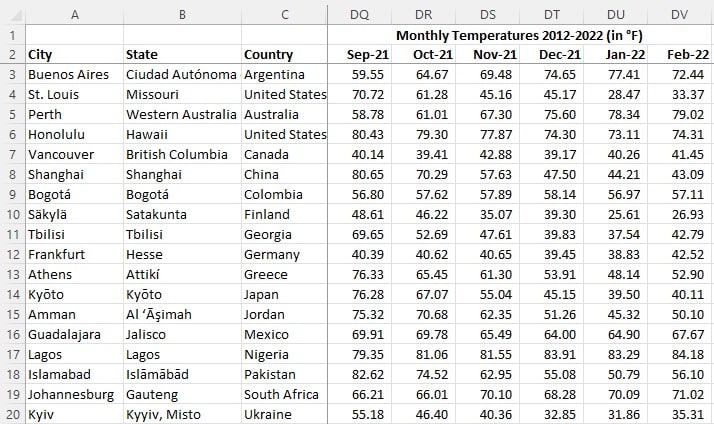
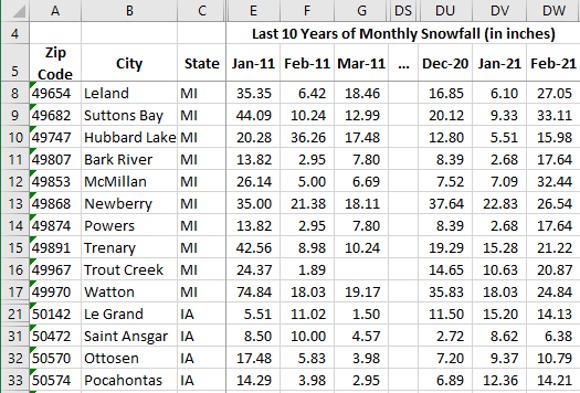
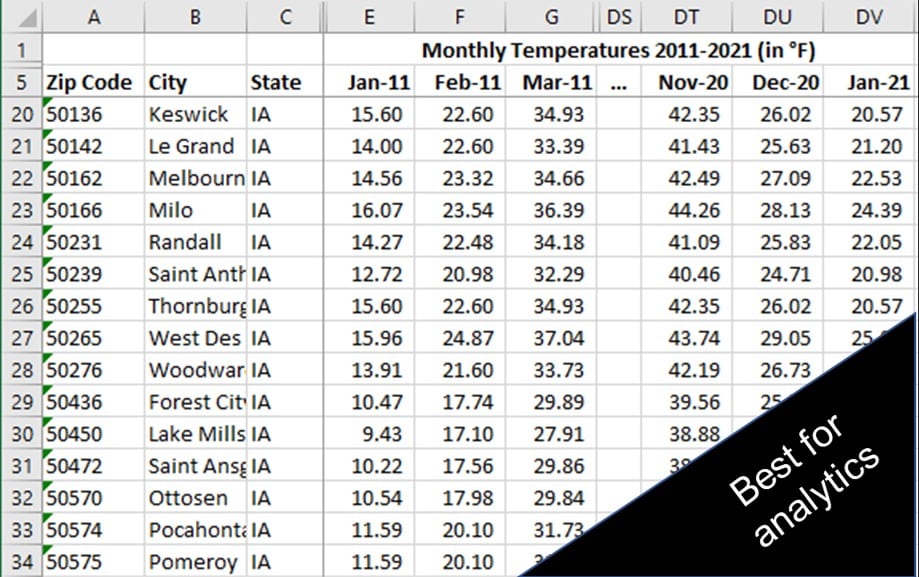
Fortunately, you have landed in the right place for that data. This download offers monthly temperature averages for all U.S. zip codes over the past decade. That’s a total of 120 data points in each zip code, and there are more than 41,000 zip codes in the country. With such a wealth of information at your fingertips, there is no limit to what your analytics efforts can uncover.
At first, you may have one specific question in mind that you want to answer when downloading this climate data set. However, as you get into the process of working with the temperature data, you’ll start to see that there are many more possibilities than what you expected initially. You’d be surprised at how much weather history has an effect on future learnings and insights.
Here are some sample questions that this data can help you address to create useful and interesting insights.
Is one side of the country getting hotter or colder faster than the other on an annual basis? With so much commercial activity focused on both coasts, businesses have a vested interest in accurately forecasting monthly or year over year climate changes in those locations. With detailed, accurate climate data available in this file, pulling out the truth is simple.
With so much talk about climate change in recent years, the last decade’s worth of temperature data across the United States can be used to spot some interesting trends. Were the hottest states of the past year the same as the hottest states from a decade ago? Let’s see what the numbers have to say.
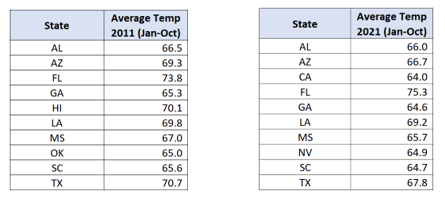
In 2011, the “Sun Belt”, South, and Hawaii made up the hottest states while in 2021, we see similar trends with the addition of California and loss of Hawaii.
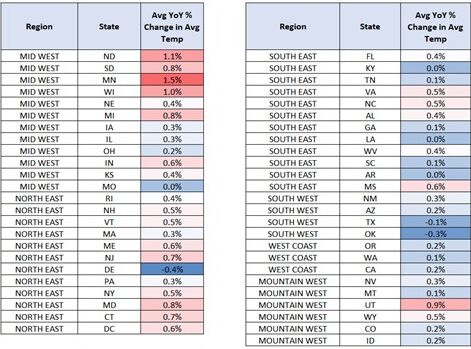
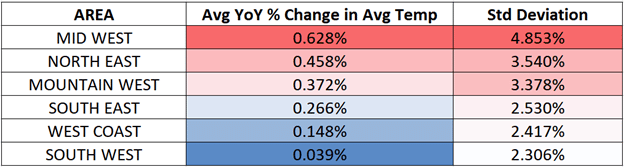
Pulling the year over year change in average temperature for various regions in the country, it looks like the Mountain/Mid West, Pacific Northwest and New England are slowly becoming hotter.
Forecasting annual population growth is an important task for both governmental agencies and private businesses. Knowing how many people are going to live in an area in the coming years makes planning far more accurate, both in terms of providing resources and for exploiting commercial opportunities. Public policy professionals can uncover unique findings by pairing historical annual temperatures to economic, demographic or environmental data. Gone are the days of relying on hundreds of weather reports to give you the information you need. We have painstakingly collected all of the weather data points from each weather station site and have meticulously gathered them into easy to use, downloadable Excel spreadsheets. You can now view average daily temperature by city, long term average temperatures by month and much more.
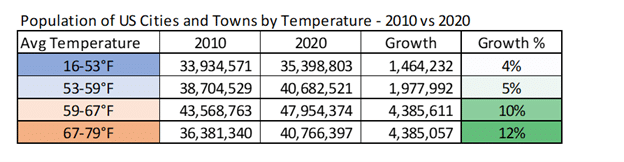
For instance, overlaying the average temperature by city over population growth reveals warmer cities and towns saw faster population growth relative to cities with colder average temperatures.
With a data set this large – there are 120 data points for each zip code, and more than 40,000 zip codes in the U.S. – you could pull out endless interesting facts as you comb the sheet. Here are a few points that can be uncovered in just a glance:
Many different industries could leverage this temperature data to make smarter decisions about their daily operations as well as their long-term planning. For instance, a business that offers meal prep services needs to understand average temperatures to determine packing procedures to avoid spoilage. Packing meals with more ice than is needed would be a waste of resources, yet not including enough ice would cause food to be wasted. Accurate temperature data can guide these critical decisions with real-world data.
Another good example of using temperature data to improve performance is a maintenance company that needs to do winterization work. When should that winterization happen? Breaking down the monthly temperature numbers can reveal detailed insights into when winter weather arrives in each individual zip code.
You don’t need to wait any longer to get started on that weather analytics project you’ve had on the back burner. With a treasure trove of accurate monthly temperatures for the entire country over the last 10 years, this Excel download can serve as the starting point for many types of analysis. Make your purchase today or contact us to learn more or to make a custom request.

120 data points per zip code, all US zip codes
Excel Download
10 years worth of monthly temperature or precipitation for all US zip codes. An analyst’s dream come true. See how sales or any other economic data is correlated to the weather.
Longer time frames as well as temperature highs or lows also available as a custom request.
Custom requests or want to be sure this is what you are looking for? Use the chat icon in the bottom left of the screen or email us at contact@weatherdatabyzipcode.com with any questions!
When doing detailed analysis, complete and accurate climate data is essential. Perhaps the biggest hurdle you face when trying to map the relationship between the weather and your business is finding trustworthy climate data to use in your analytics. With the right source of data, it’s amazing what insights you can bring to life.
Fortunately, you have landed in the right place for that data. This download offers monthly temperature averages for all U.S. zip codes over the past decade. That’s a total of 120 data points in each zip code, and there are more than 41,000 zip codes in the country. With such a wealth of information at your fingertips, there is no limit to what your analytics efforts can uncover.
At first, you may have one specific question in mind that you want to answer when downloading this climate data set. However, as you get into the process of working with the temperature data, you’ll start to see that there are many more possibilities than what you expected initially. You’d be surprised at how much weather history has an effect on future learnings and insights.
Here are some sample questions that this data can help you address to create useful and interesting insights.
Is one side of the country getting hotter or colder faster than the other on an annual basis? With so much commercial activity focused on both coasts, businesses have a vested interest in accurately forecasting monthly or year over year climate changes in those locations. With detailed, accurate climate data available in this file, pulling out the truth is simple.
With so much talk about climate change in recent years, the last decade’s worth of temperature data across the United States can be used to spot some interesting trends. Were the hottest states of the past year the same as the hottest states from a decade ago? Let’s see what the numbers have to say.
In 2011, the “Sun Belt”, South, and Hawaii made up the hottest states while in 2021, we see similar trends with the addition of California and loss of Hawaii.
Pulling the year over year change in average temperature for various regions in the country, it looks like the Mountain/Mid West, Pacific Northwest and New England are slowly becoming hotter.
Forecasting annual population growth is an important task for both governmental agencies and private businesses. Knowing how many people are going to live in an area in the coming years makes planning far more accurate, both in terms of providing resources and for exploiting commercial opportunities. Public policy professionals can uncover unique findings by pairing historical annual temperatures to economic, demographic or environmental data. Gone are the days of relying on hundreds of weather reports to give you the information you need. We have painstakingly collected all of the weather data points from each weather station site and have meticulously gathered them into easy to use, downloadable Excel spreadsheets. You can now view average daily temperature by city, long term average temperatures by month and much more.
For instance, overlaying the average temperature by city over population growth reveals warmer cities and towns saw faster population growth relative to cities with colder average temperatures.
With a data set this large – there are 120 data points for each zip code, and more than 40,000 zip codes in the U.S. – you could pull out endless interesting facts as you comb the sheet. Here are a few points that can be uncovered in just a glance:
Many different industries could leverage this temperature data to make smarter decisions about their daily operations as well as their long-term planning. For instance, a business that offers meal prep services needs to understand average temperatures to determine packing procedures to avoid spoilage. Packing meals with more ice than is needed would be a waste of resources, yet not including enough ice would cause food to be wasted. Accurate temperature data can guide these critical decisions with real-world data.
Another good example of using temperature data to improve performance is a maintenance company that needs to do winterization work. When should that winterization happen? Breaking down the monthly temperature numbers can reveal detailed insights into when winter weather arrives in each individual zip code.
You don’t need to wait any longer to get started on that weather analytics project you’ve had on the back burner. With a treasure trove of accurate monthly temperatures for the entire country over the last 10 years, this Excel download can serve as the starting point for many types of analysis. Make your purchase today or contact us to learn more or to make a custom request.