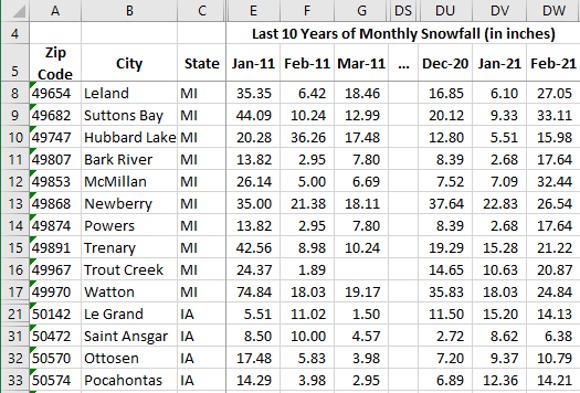
What Can You Do with The Average Temperature of Each Global City?
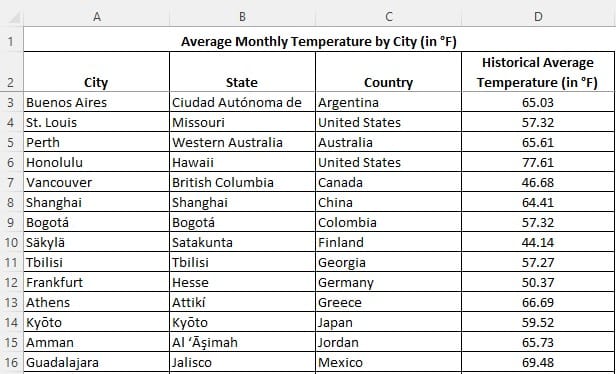
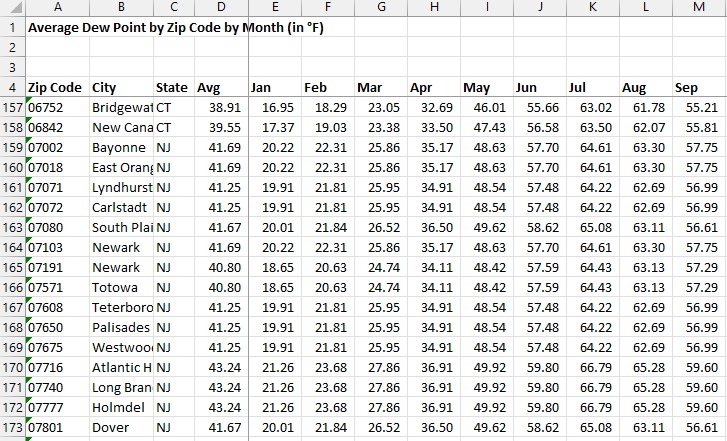
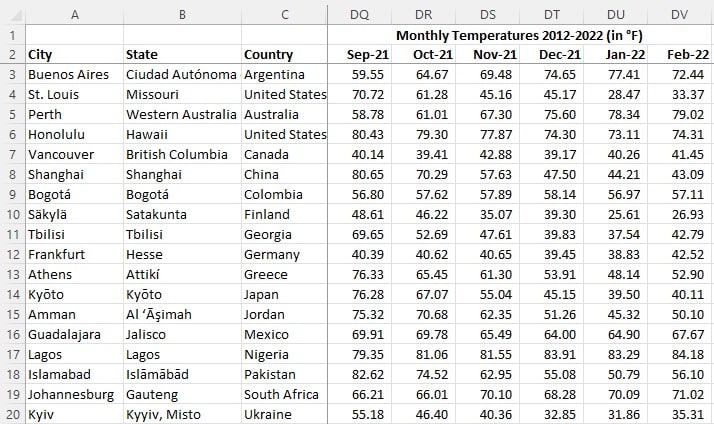
This data set is an excel spreadsheet containing the historical average temperature for over 40,000 cities across the globe. There is 1 data point per location. The spreadsheet is user friendly, with each city, state and country oriented vertically with its respective long term average temperature.
The main benefit of this data set is that it’s a one-stop shop for ALLglobal cities and you can get a snapshot of average temperatures by region, country, and more rather than having to plug in one city at a time—which is the case with most free weather data websites.
What are some of the applications of average temperature by city/country and how might you use this data? Below are some of the types of questions you can answer with this dataset:
- Are there observable temperature trends in cities around the world?
- Which country has the highest annual average temperature and how does this impact things like agriculture?
- What is the relationship between average temperatures and tourism?
- What are the geographical trends regarding climate change and which cities are being impacted most?
- Where are the hottest and coldest cities in the world?
- How does temperature fluctuate in different regions around the world?
Global Tourism Forecasting
A region’s temperature and climate can have a huge impact on tourism trends.
If the weather conditions are too hot and humid during certain months, then people may be less willing to visit. Monsoon season and other natural disaster-prone times are also hindrances to tourism. This can have ripple effects on businesses and governments that rely on tourism for income.
Additionally, this list of average annual temperature data from one city to the next can be used to forecast tourism trends. Are certain emerging areas seeing temperatures rise? Does the temperature increase in parts of Europe have a correlation in the increase or decrease of tourism to those areas?
This data can be processed and extrapolated to help with establishing tourism trends and forecasting how future weather trends could change the way companies and governments think about tourism.
Agricultural Trends and Viability
Agriculture depends so much on seasonality, climate conditions, temperatures as well as other environmental factors.
The world of agriculture is constantly evolving, and the data on global temperatures and average temperature by city can be extremely useful when it comes to crop planning. For instance, there are some locations where an upward trend in temperature could see certain crops become less viable. If your forecast says that certain crops may not grow then it is worth reconsidering your planting strategy. Alternatively, it could be that further irrigation measures are needed.
On the flip side of this, changes in average temperatures in Europe may mean that there are chances for wine regions to develop further north, in the UK and Germany as well as countries like France and Italy.
Consumer Patterns
Perhaps you manufacture products that are most useful in certain conditions. Industries such as HVAC depend highly on the weather conditions but there are many other consumer trends that appear in relation to climate changes. Studies have shown that on wet days, for instance, websites that sell homeware and furniture see increases in traffic.
Food and beverage industries also have a lot of use for forecasting, and specific types of food and drinks sell better in certain temperatures This data can also be used to project how long food may be stored in warehouses and storage facilities.
Climate Change
All data we have on climate change is useful. Using this dataset to spot trends and patterns in different locations means we can see the impact that climate change has already had and project more about the future of global temperatures. Climate studies are pertinent and the more information we have, the better, and the more insightful analysis we are able to get.
Which City Has The Highest Average Temperature?
An interesting fact pulled from the data: Mossoró in Rio Grande do Norte has temperatures averaging over 90°F, and some cities in Ethiopia have a similar average temperature.
What is Europe’s Average Temperature?
Another fun fact is that the average temperatures in Europe fluctuate greatly from one region to the next.
Our data allows you to extrapolate certain areas of Europe and work out the temperature by country, region, or even for the whole of Europe. In Russia, in cities such as Kazan, the average low can be around 32°F, but the average temperature overall is 41.47°F.
Contrast this with Las Palmas, a Southern Island and territory of Spain, where the overall average temperature is 69.97°F.
WeatherDatabyZipCode has meticulously collected readings of historical average temperatures for over 40,000 global locations, allowing companies and individuals to apply this data to a variety of commercial, academic and personal uses. For questions on custom orders, please contact our team at. contact@weatherdatabyzipcode.com today.