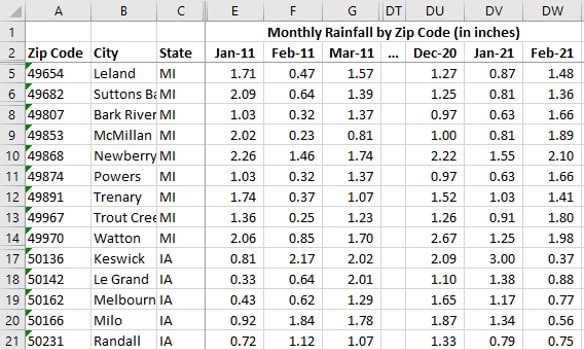
An Overview of the ‘10 Years of Monthly Rainfall Data by Zip Code’ Dataset
Monthly temperature and precipitation outlooks are a staple of industry and government planning in major cities across the United States. The average monthly rainfall is recorded from thousands of weather stations across the country and then organized into an Excel spreadsheet for an easy-to-access resource for corporations, nonprofits, individuals, and government entities. This information can be used to forecast trends in any of these sectors with ease.
Some Questions This Climate Data Can Help You Answer
Using precipitation outlooks for projection is a long time standard practice of many organizations, however, in recent years, this data has become more important than ever before as climate change has become a part of the world conversation. Here are some frequently asked questions about average rainfall monthly over a ten-year period, and how these questions can be used for the public good.(1)
What is the wettest city in America based on the monthly 10 year averages?
By calculating the averages over a ten-year period, Hakalua, Hawaii on the Big Island is determined to be the wettest city in America where they see on average 19 inches of rain per month or ⅔ of an inch per day.
In the Lower 48, its Crescent City, California which sees an average of 10 inches of rain per month or 1/3 of an inch per day. The practical implications are clear, especially as this is in a touristy area. Someone looking for a lot of sunshine on their vacation may avoid this spot, while others who enjoy the rain may seek it out.
Those who are starting businesses would also do well to calculate rainfall in their chosen city. Those who have businesses that rely on outdoor venues (such as theme parks, ice cream stands, etc) may want to avoid the wettest places. On the other hand, the umbrella industry would do well there.
What is the driest month across all US zip codes based on the last 10 year averages?
Another question that can be quickly extrapolated from the data. Over the last 10 years, the driest month the US saw was November 2012. November and January tend to see the least rainfall while May takes the crown as historically the wettest month across the US.
Wildfire season is carefully determined by studying the data. This is extremely important to know so the government can share warnings about campfires and put regulations in place to prevent sparking a fire. The dry season is also taken into account for the enactment of water-saving precautions. This is true across many states at different times of the year.
How Can Weather Data Be Used in Private and Public Sectors?
Weather data, especially in regards to precipitation, can be used by organizations in a number of different ways. These details and insights are invaluable for agricultural tables, crop planning, city planning, and a number of other service industries. (2)
Here are some examples of how weather details can be used by both private and public entities:
- City planners will use this information as well as average temperature data when zoning in certain areas, as there can be a tendency toward flooding or sewage issues.
- Farmers use precipitation data over time to determine the most accurate times for planting and harvest, as well as types of crop to plant, crop rotation, and other decision-making. Determining which crops can be grown in certain areas is entirely dependent upon the average annual rainfall of the area.
- Climate scientists use this information to determine changes to the larger weather patterns and note how they may continue to change in the future. This is submitted to governing bodies in an attempt to foment change in government and private industry policy.
- Companies (especially national and international companies) will use this climate information to plan logistics and determine how to best transport goods.
- Organizations can use this climate data to plan and organize large events like conventions or annual meetings. Rainy seasons can determine what venues are chosen, and in which cities–especially for outdoor events.
- City-by-city research on precipitation norms can determine whether a business is a good prospect for a certain area. As aforementioned, certain businesses that depend on fair weather to operate won’t want to open or move to a city that is consistently overcast and rainy. (Open air racetracks or stadiums, water parks, and other things of this nature).
In the same vein, something like a water park may do well in a place without as much precipitation, but may falter in an area that has a lot of water restrictions due to frequent drought. Precipitation and general weather data can help find a happy medium in these cases.