A Decade of Valuable, Accurate U.S. Humidity Data
The best way to know what you can expect in terms of humidity in a certain location is to look at recent history. This Excel download provides you with nicely formatted humidity records by zip code for each month over the last ten years. As we’ll explain below, this kind of information can be put to use for many different reasons, and it may help your organization make better decisions moving forward.
What is the Difference Between Dew Point & Relative Humidity?
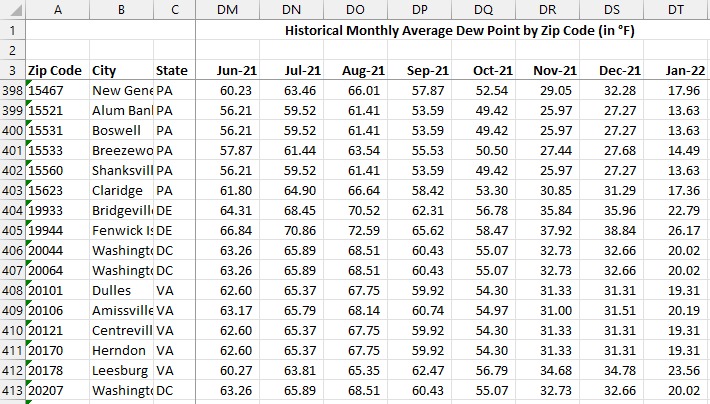
When looking at humidity information, you are likely to also come across dew point measurements. These are not the same thing, although they are related. As this is a common point of confusion for those who are not meteorologists, it’s important to clear up this question so the humidity data we provide can be used appropriately.
Let’s offer quick definitions of each of these two measurements
- Relative humidity measures how much moisture is in the air as a percentage of how much moisture the air would be able to hold. So, if the relative humidity is 50%, that means the air is currently holding half of the water it is able to contain.
- Dew point is the temperature at which the relative humidity would reach 100%. It is expressed as a temperature, so you might see the dew point listed at 50*F for a specific place. That means if the temperature cools to 50%, a RH of 100% will be achieved.
As you can see, the two are closely related, but not quite the same thing. It’s important to look at both, as they can give you a clearer picture together than they can apart.
What Can You Do with Humidity Data?
It’s no secret that humidity can play a major role in human comfort. It’s difficult to do hard, physical labor all day long, for example, if the humidity is high on a summer day. Humidity data can be used for more than just planning how you’ll keep people in your organization comfortable, however, as moisture levels in the air also impact how machinery will work.
For example, humid areas may require equipment to be serviced – and even replaced – more often than in areas with typically dry air. Rather than guessing at these effects and being caught off-guard down the line, you can use this data set to accurately determine how well your equipment will hold up in the areas it is going to be used.
Examples of Real World Applications
You may already have your own ideas for how you’ll use this humidity data, but here are a few ideas just to help you understand the possibilities –
-
A governmental organization may evaluate humidity levels as a way of knowing when more public health services will be required. Areas with hot, humid summers may have periods when the homeless and other at-risk populations need additional support
-
An office building in a humid city will likely incur greater energy costs as the air conditioning system has to work harder in the summer months to keep the building comfortable
-
A transportation company operating a fleet of vehicles in humid locations will want to pay close attention to rust and other maintenance issues due to moisture in the air
Frequently Asked Questions
Where can I download weather data?
It’s easy to find weather forecasts for the next 10 or 15 days, but it’s much harder to find quality sources of historical weather data. This information can be hugely valuable when making important decisions, so obtain your data from a trustworthy source like Weather Data by Zip Code.
Is 75% humidity high?
It’s always hard to quantify what counts as “high” for humidity, because that depends on various factors – most notably, temperature. If you experience 75% humidity along with high temperatures, those conditions are likely to be quite uncomfortable for most people. That same relative humidity measurement at a lower temperature, however, could remain perfectly comfortable.
Is high or low humidity better?
Most of the time, a sweet spot of between 40% and 60% will be the ideal humidity range. If the humidity is too high, humans tend to be uncomfortable and the additional moisture in the air could cause problems for equipment. On the low end, humans are usually pretty comfortable (other than dry skin issues), but the very dry air can again lead to some problems for equipment and machines, such as materials that dry up and crack.