The Uses of Average Global Monthly Temperature Data
Temperature data is always useful, and it is always changing. By using monthly averages you can see exact trends of temperatures and seasonality within different global regions, which might inform certain changes or decisions you make in your business and personal life.
This easy to read dataset has a lot of useful information, and holds the answers to the following questions and more:
- How much of an impact does seasonality have on tourism in certain locations around the world?
- What are the best times to start growing and harvesting cycles?
- Which locations are most suitable to grow certain crops?
- What are the best ways to design buildings in certain locations in order to maximize heat efficiency?
- What public policies need to be in place at certain times in the year for public health protection?
- Are certain areas getting hotter (or colder) over time?
Decisions on Architecture
Different styles of architecture have been implemented around the world in order to best suit the weather conditions. For example, in hotter locations there may be a conscious decision to have fewer windows in a design, and to ensure the roofing and walls on the house are painted white and do not conduct as much heat. On the contrary, for colder regions, insulation would be a large consideration in the planning and development stage of a new structure.
Optimizing Production
By using average monthly temperatures, businesses that rely on seasonality, or have crops and processes that are dependent on temperature can make more accurate predictions.
For instance, an agricultural company could use simulations based on the dataset to work out their best possible chance of optimizing their processes, from irrigation to planting seeds and harvesting crops.
It’s not just agriculture, other businesses rely on seasons and temperatures. Areas like the fishing industry can garner a lot of useful information from average monthly temperatures, and make decisions accordingly.
Forecasting Costs
With the cost of energy so high, and accountancy playing a crucial role in most businesses, forecasting your costs is nothing short of essential.
If you run a large facility such as a factory or office and need to pay for heating and cooling, it is really important to work out what your costs will be, and how much they may vary with the different months and seasons. This can help you to ensure profitability within your business, budget accordingly, and even make changes to the way you operate to save money.
Understanding Climate Change on a Different Level
Climate change data is about more than just rising temperatures. It can lead to more extreme winters as well as higher heats in the summer. Data that takes into account the monthly trends helps with an extra layer of analysis and understanding.
Estimate Health Trends and Support Required
Both the extreme heat and the extreme cold can lead to public health issues. Not only this, temperature can play a part in disease transmission, and knowing what the average is from one month to another means that public health policies can be altered and more support provided.
In the extreme cold, for instance, lives can be at risk if sufficient heating is not ensured. Hospital admissions can also go up in the summer as the heat causes its own problems to public health.
What is The Hottest Month?
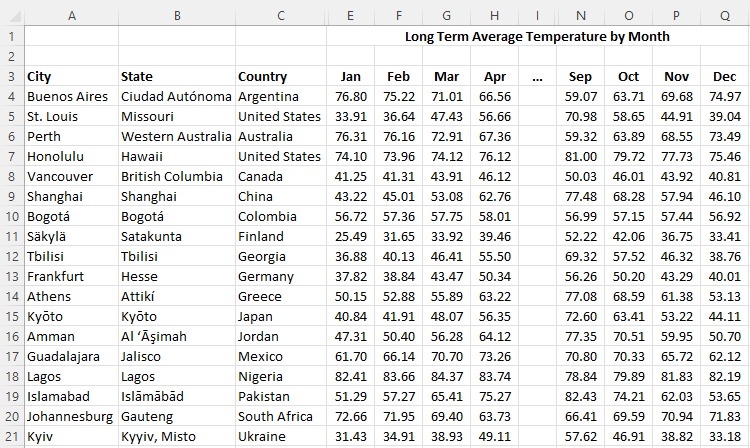
This is dependent on where you are in the world, and shows the uses of our data. It allows you to check the average heat in each month over the last 10 years from one location to the next. Over 40,000 cities are included. Generally speaking, July, and August are the hottest months for locations in the Northern Hemisphere. In some countries, August may be warmer than July, and vice versa.
December, January, and February are the warmest months in the Southern Hemisphere, but again, the specifics can vary from one location to the next. Seasonal lag means that there is a ripple effect in the warmest months around the world, as our data will help to show.
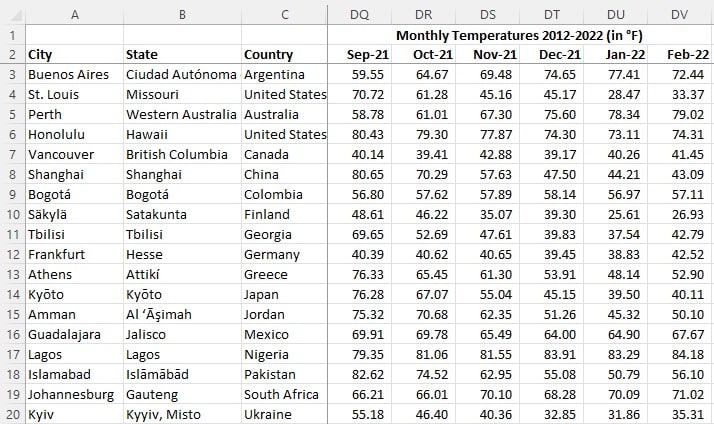
The world’s average temperature data is constantly changing, and climate change plays a huge part in this.
To make informed decisions about the future, you need access to accurate historical data. WeatherDatabyZipCode has meticulously collected readings of average monthly temperatures for over 40,000 global locations, allowing companies and individuals to apply this data to a variety of academic and industrial uses. For questions on custom orders, please contact our team at. contact@weatherdatabyzipcode.com today.