We know that Oregon loves beer. With nearly the highest number of craft breweries per capita and the most amount of craft beer gallons consumed per capita, there is no doubt Oregon loves beer.
We always assume that the connection between beer and the city is just a quirky part of the city’s charm, but what if we said there was more to it? Looking at past weather reports, the data shows a lot of different patterns and trends across Oregon that can tell us a bit more about the love affair between Oregon and beer.
What rainfalls total by zip code tells us about Oregon’s love for beer
But when we look at temperature history by zip code in the area, is that a fair-weather affair?
The short answer?
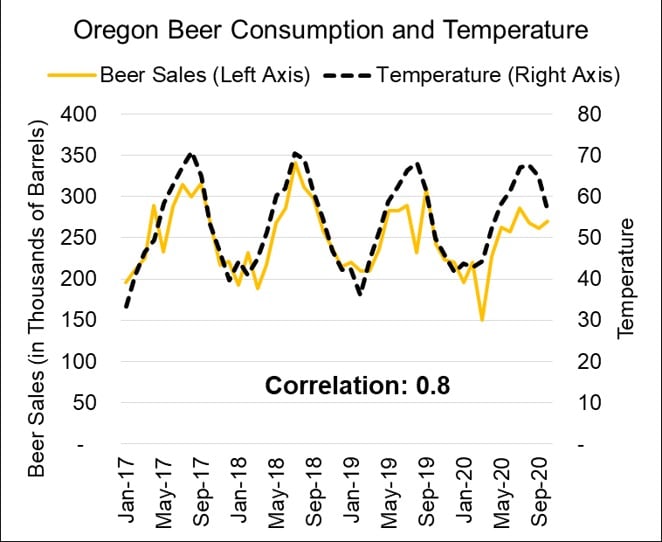
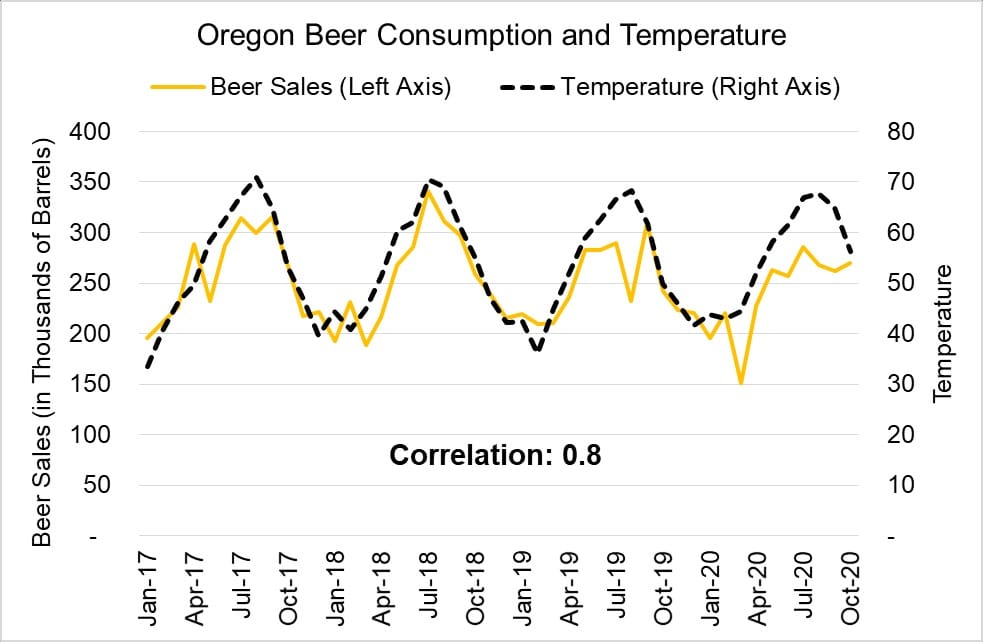
Yes, Oregon beer consumption is highly correlated with the temperature.
But our analysis didn’t stop there.
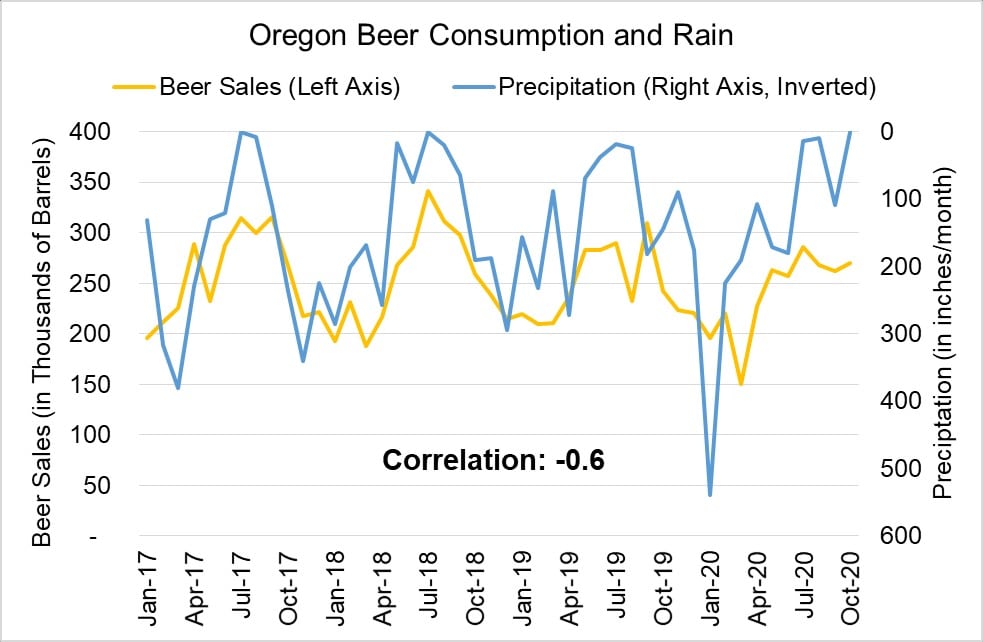
Meanwhile, beer consumption is inversely correlated to rainfall. The correlation is strong but not as impactful as temperature. It was interesting to see that weather was indeed a connection.
Temperature plays a more prominent role than we think it does, and it’s only by looking at past weather data do we get more insight into that. Looking at temperature history by zip code in more detail uncovers more around this, and we can see another angle in consumption. The data is instrumental in shedding light on how regions experience weather-sensitivity, how that drives consumption, and how past weather reports can improve connections with customers.
Past weather reports and Oregon’s love for wine
We thought it would be interesting to expand the analysis beyond beer and look at whether there were any trends we could spot in wine within a similar context. This time, we asked, “what about wine?”
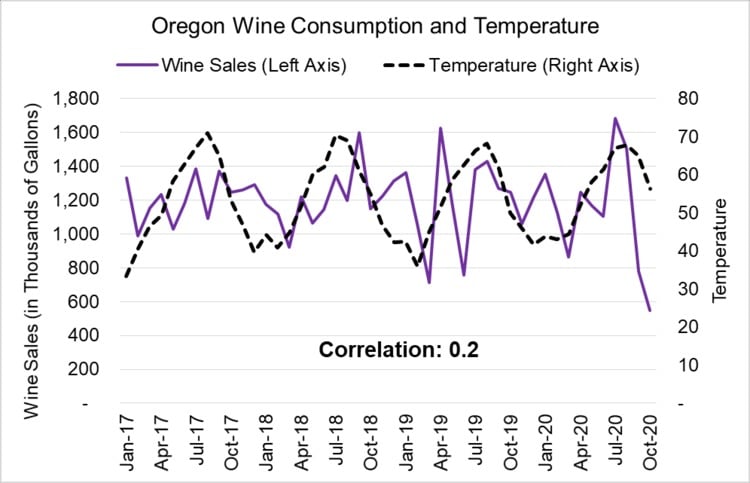
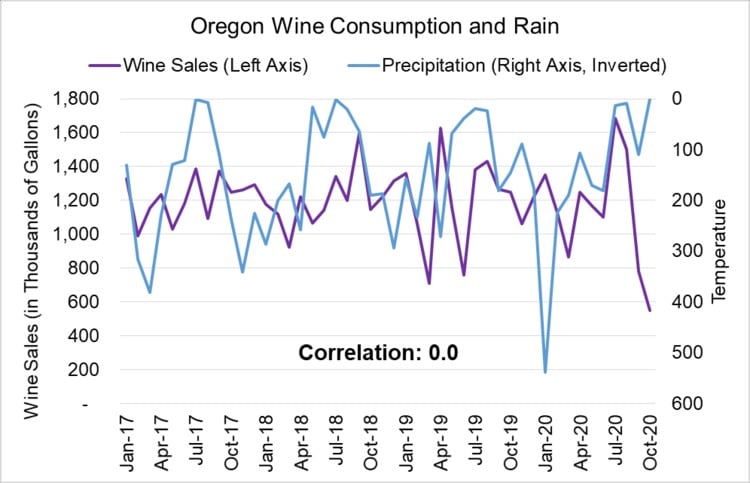
Our analysis into temperature history by zip code found that wine consumption in Oregon has nearly no correlation to either temperature or precipitation. At 0.2 and 0.0, wine consumption and temperature are almost perfectly uncorrelated.
This was a bit of a surprise considering the strong correlations we found between rainfalls total by zip code and beer consumption in Oregon and definitely something we wanted to explore. If we were to continue this thread, the next step of the analysis would be to isolate red wine from white wine and see how temperature and rainfall impact wine by varietal.
Our findings concluded that Oregon certainly isn’t alone when it comes to beer consumption being impacted by weather, but it is one of the more “weather-sensitive” states. Colder states like Oregon tend to see beverage consumption fluctuate more with the weather relative to warmer or more humid states.
The data ultimately showed that weather-sensitivity is definitely a factor in consumption habits, whether or not we make that connection consciously. Taking a detailed look at past weather reports and carrying out analyses is an incredibly helpful tool for companies.
Having that level of insight into rainfalls total by zip code and temperature history by zip code can help across sales, marketing, operations, and many other areas. We’ve written in the past about trends that we have uncovered by looking at temperature history by zip code, and we’re always pleasantly surprised by the correlations and patterns we discover!
To learn more about what you can accomplish with past weather reports and access accurate and precise rainfalls total by zip code and temperature history by zip code, download our spreadsheet today to uncover more from our data!


